XL Analyzer
XL Analyzer for Dynamics SL
It’s not just accounting anymore. Today’s accountants and financial professionals are tasked with analyzing data within ERP systems as well as operational systems within the organization to understand results and provide needed information for sound, data-backed decisions. Now you can enjoy accessing your Dynamics SL data from Excel and make use of Excel’s analytical tools, including Pivot Tables.
XL Analyzer is the best analysis tool for your Dynamics SL business data. This Microsoft Excel integrated reporting tool gives users the ability, with just a few clicks, to build formulated spreadsheets and pivot tables with your Dynamics SL modules data. Excel pivot tables are “live”, meaning they can be “refreshed” to reflect the latest changes in your database.
XL Analyzer is context sensitive, allowing users to drill down to bring the underlying information into another sheet for more detailed analysis. For example, if you are viewing a customer statement, you can select a cell to drill down to find the original document, which comes up as a new tab within the spreadsheet.
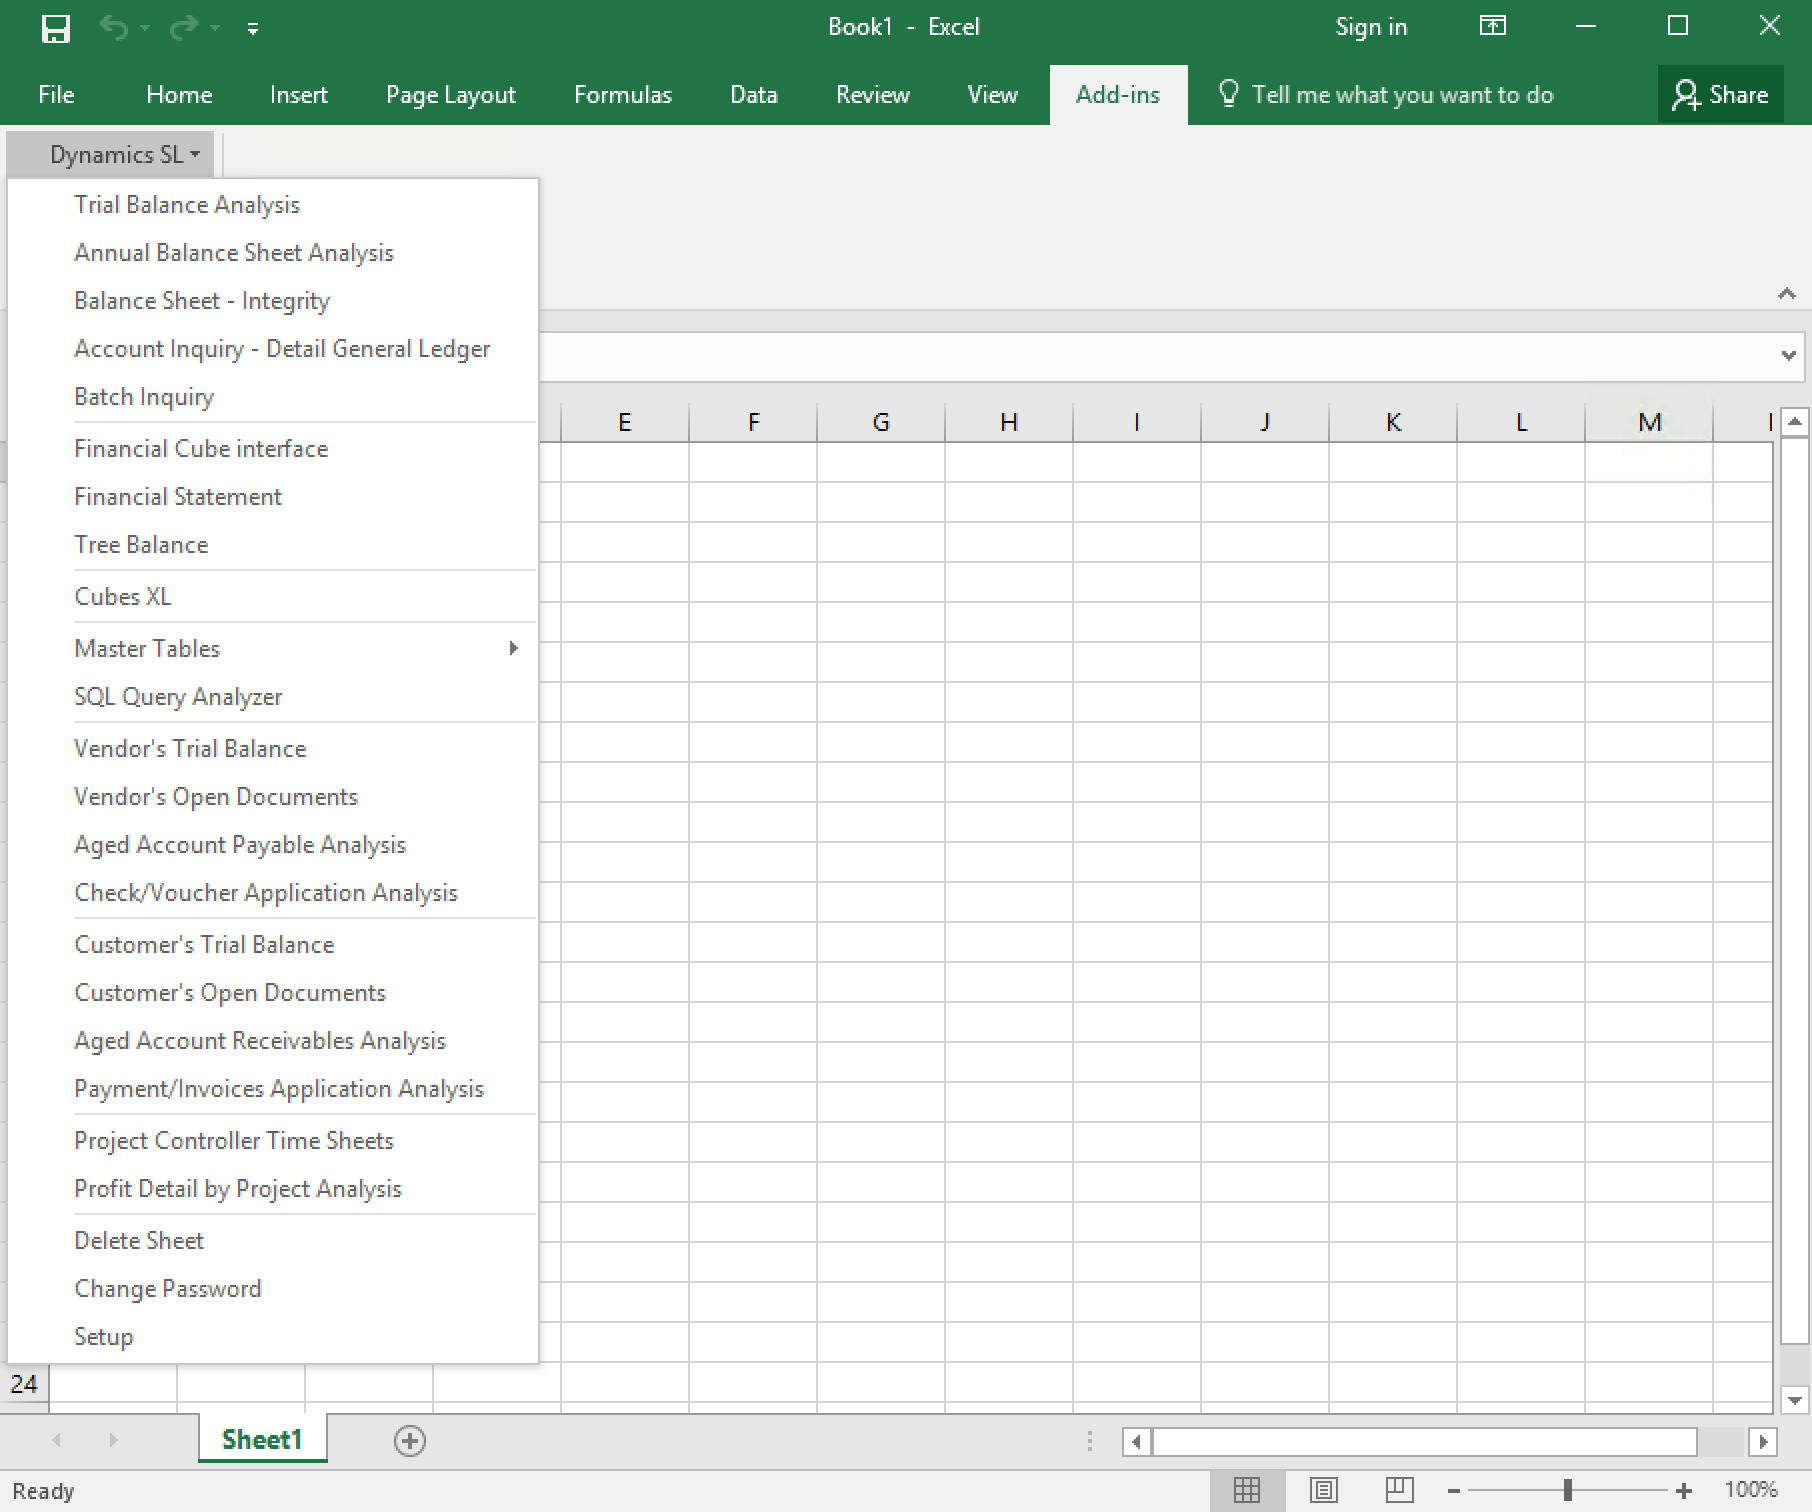
XL Analyzer has 3 kind of inquiry tools / reports for Microsoft Excel:
Watch Live Demo
XL Analyzer is a great Financial companion
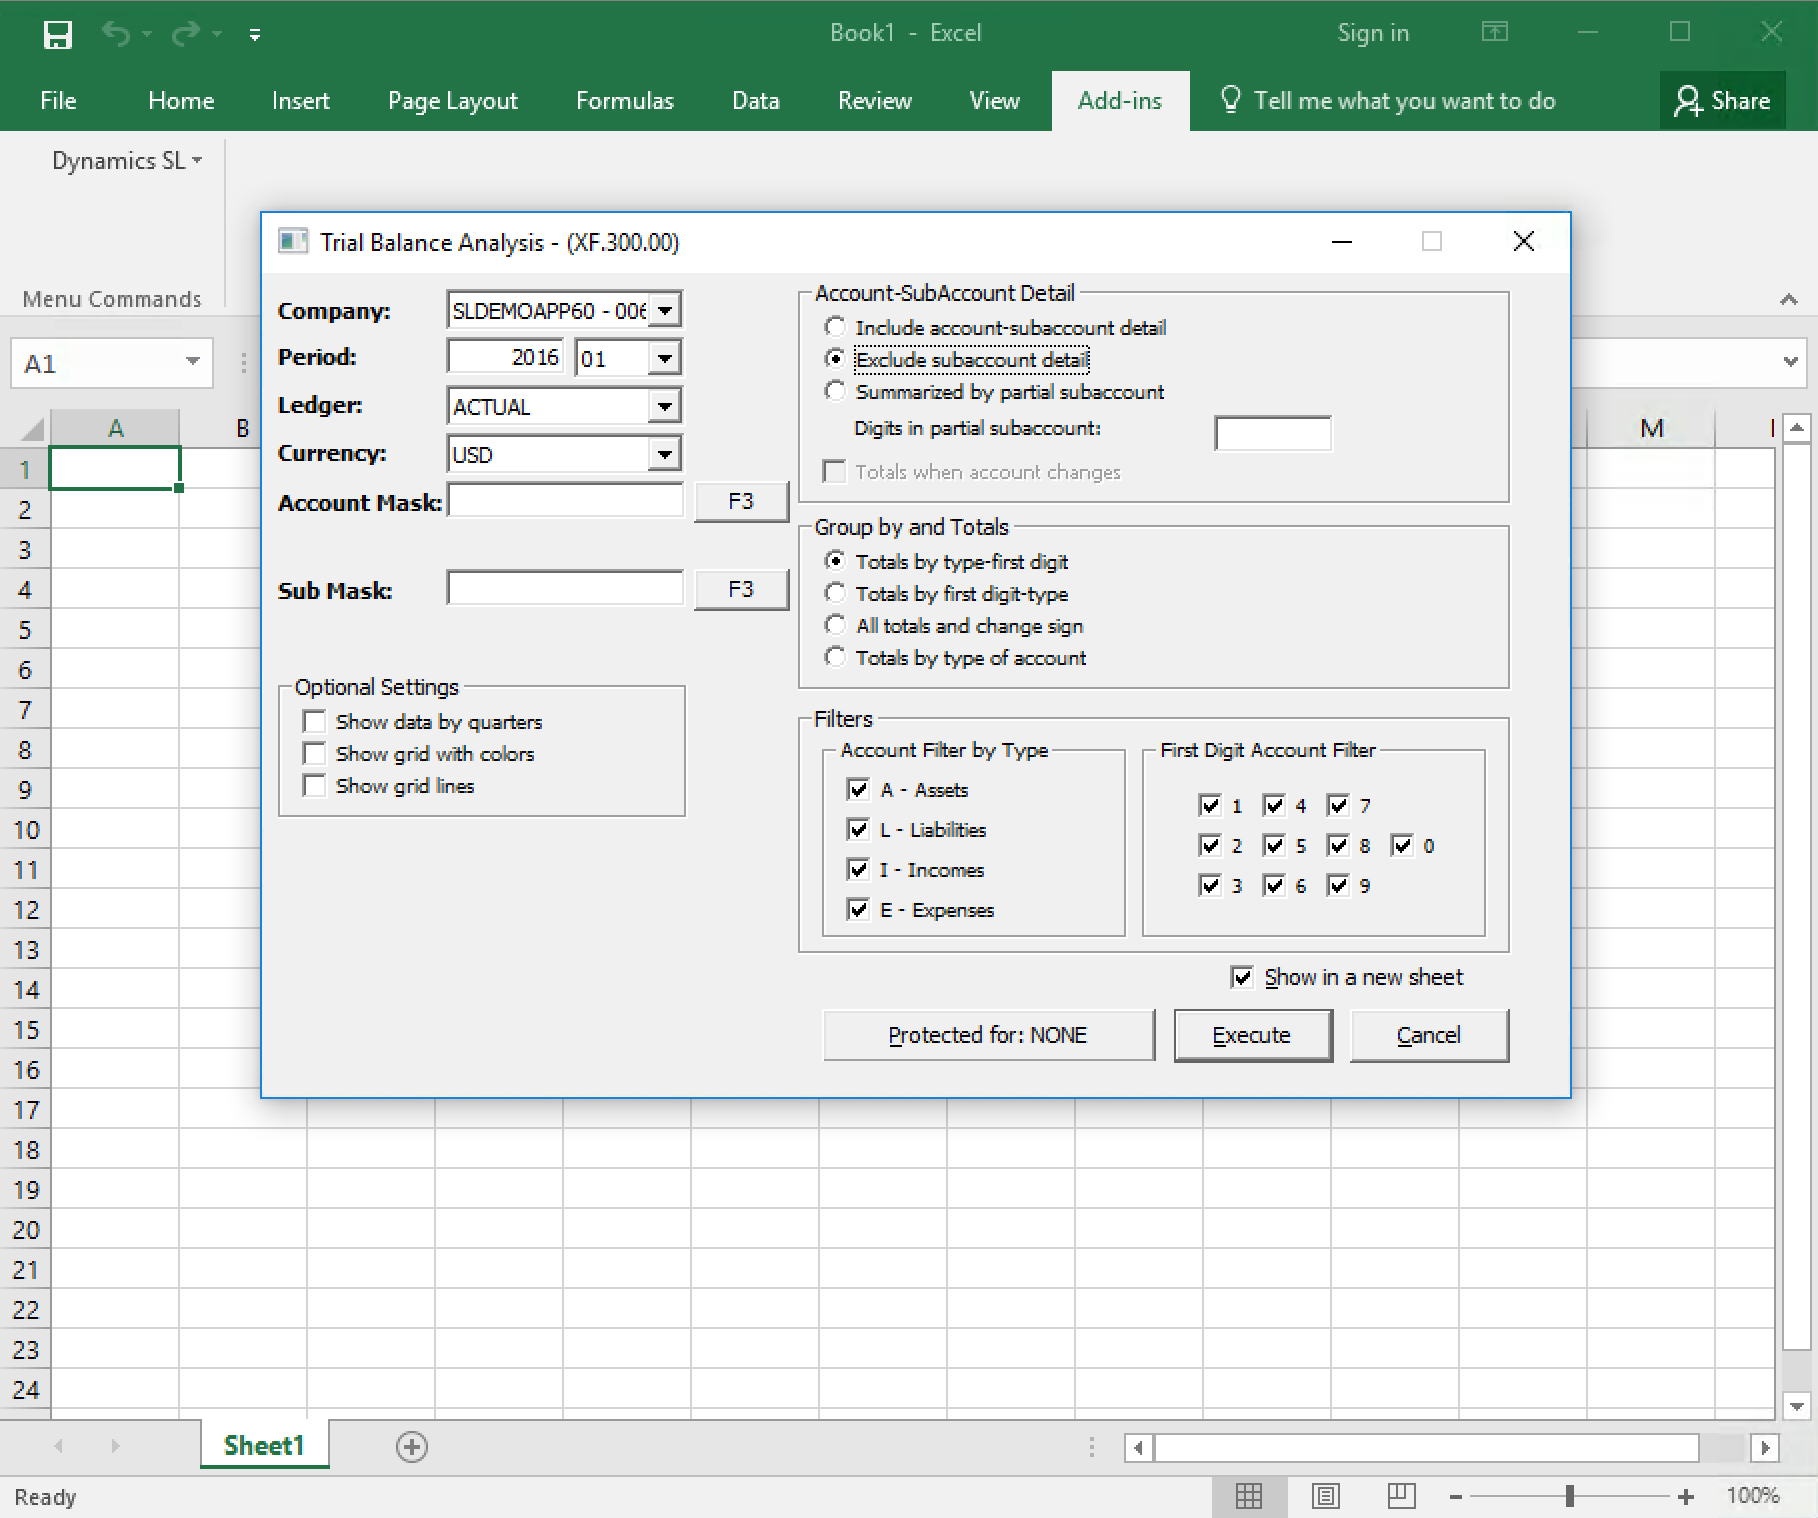
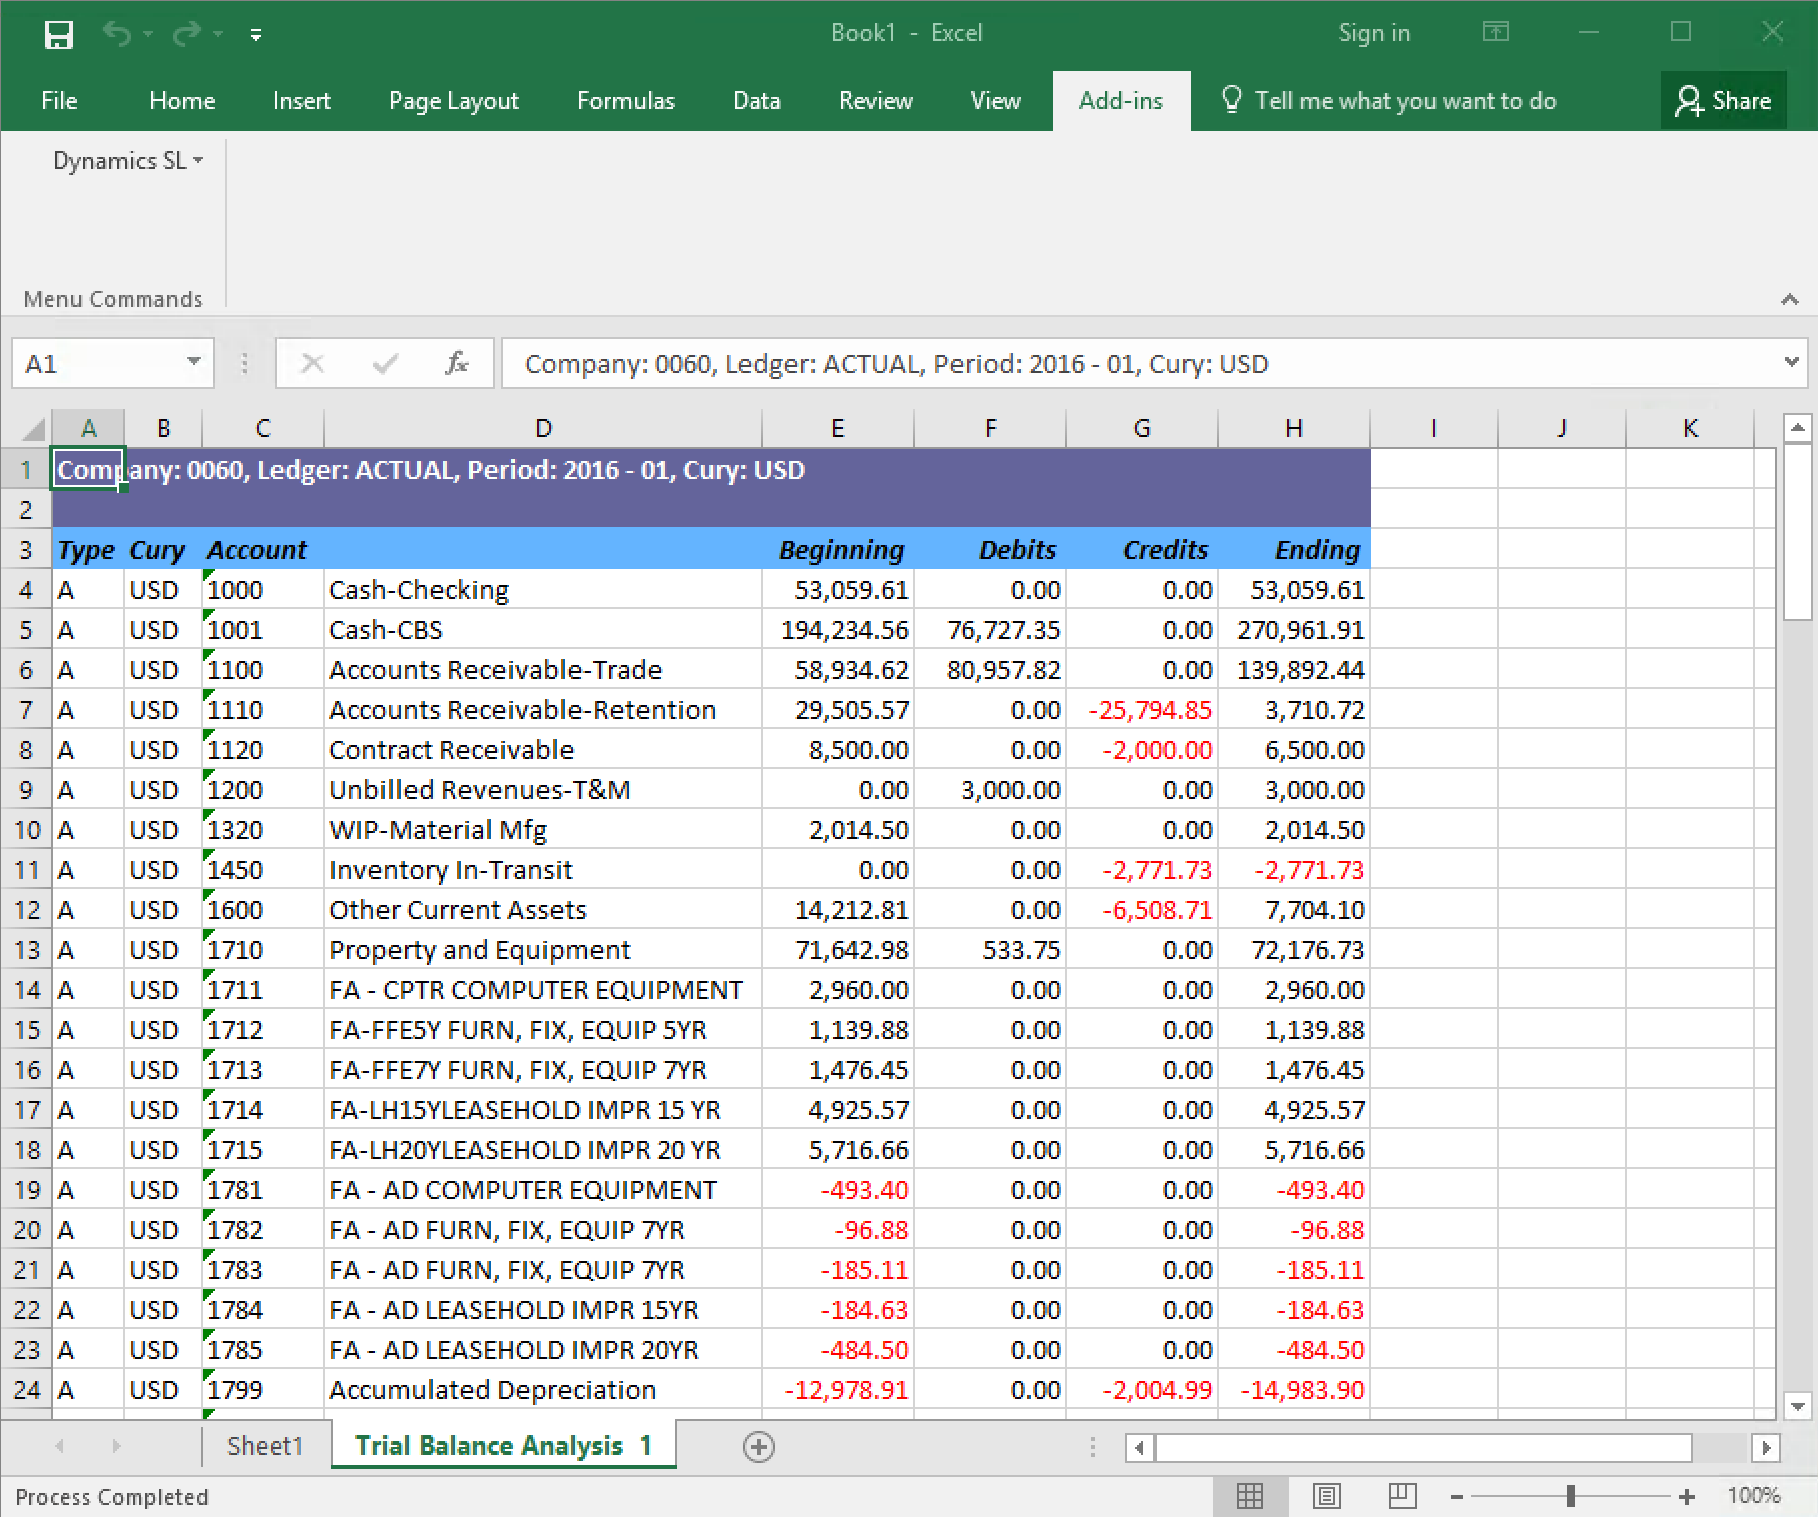
Trial Balance Analysis.
Very simple language in the dialog box, straight forward. From this report spreadsheet users can “drill down” into any of the figures. In the last image the cell C6 is selected, and the option of Account Inquiry was selected.
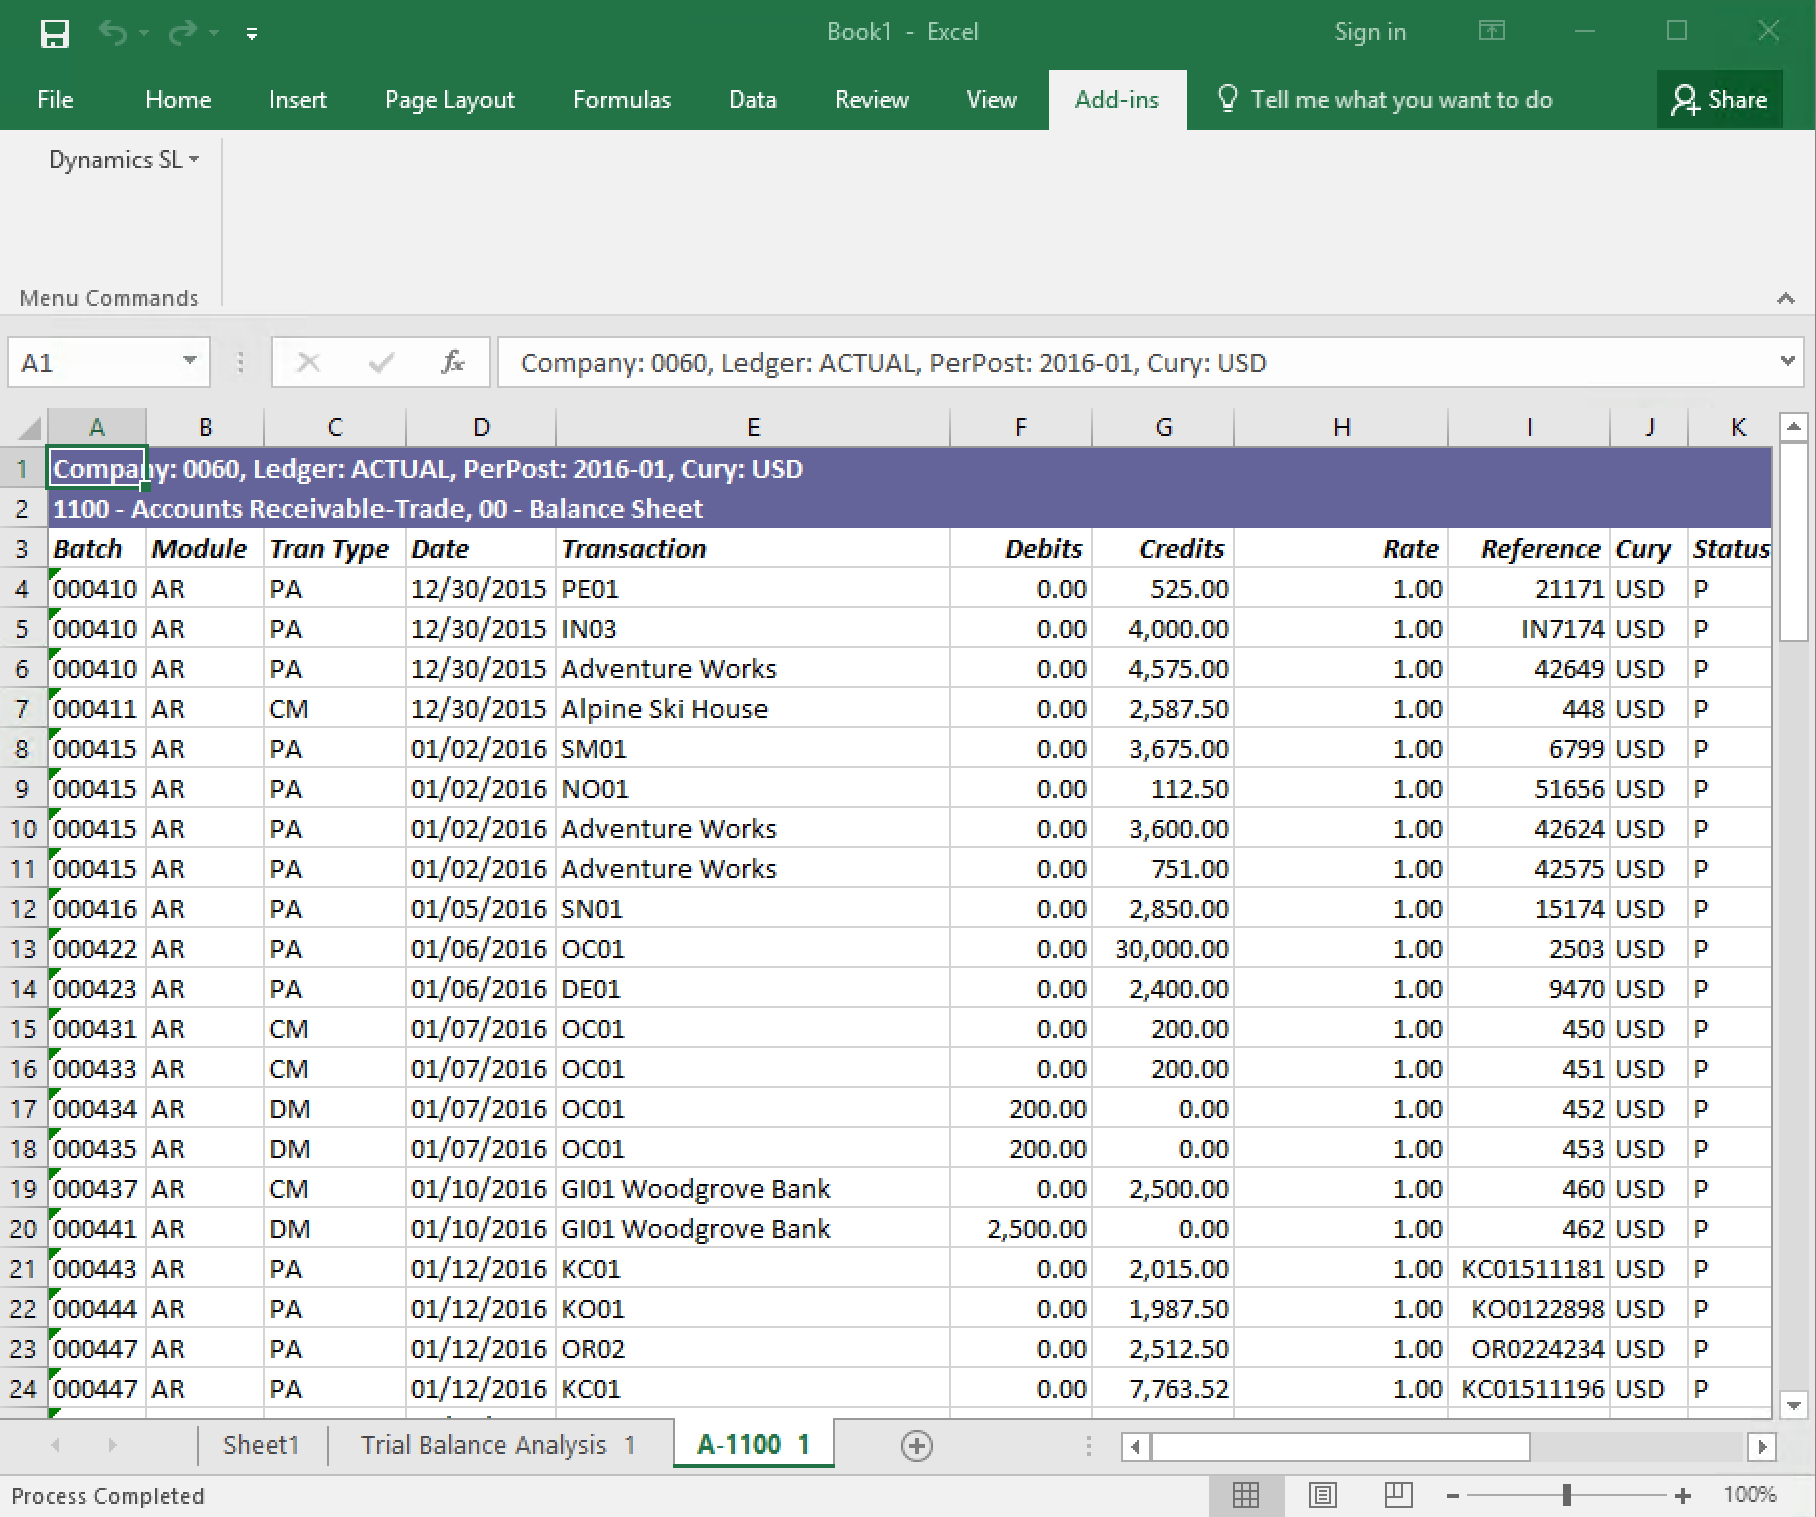
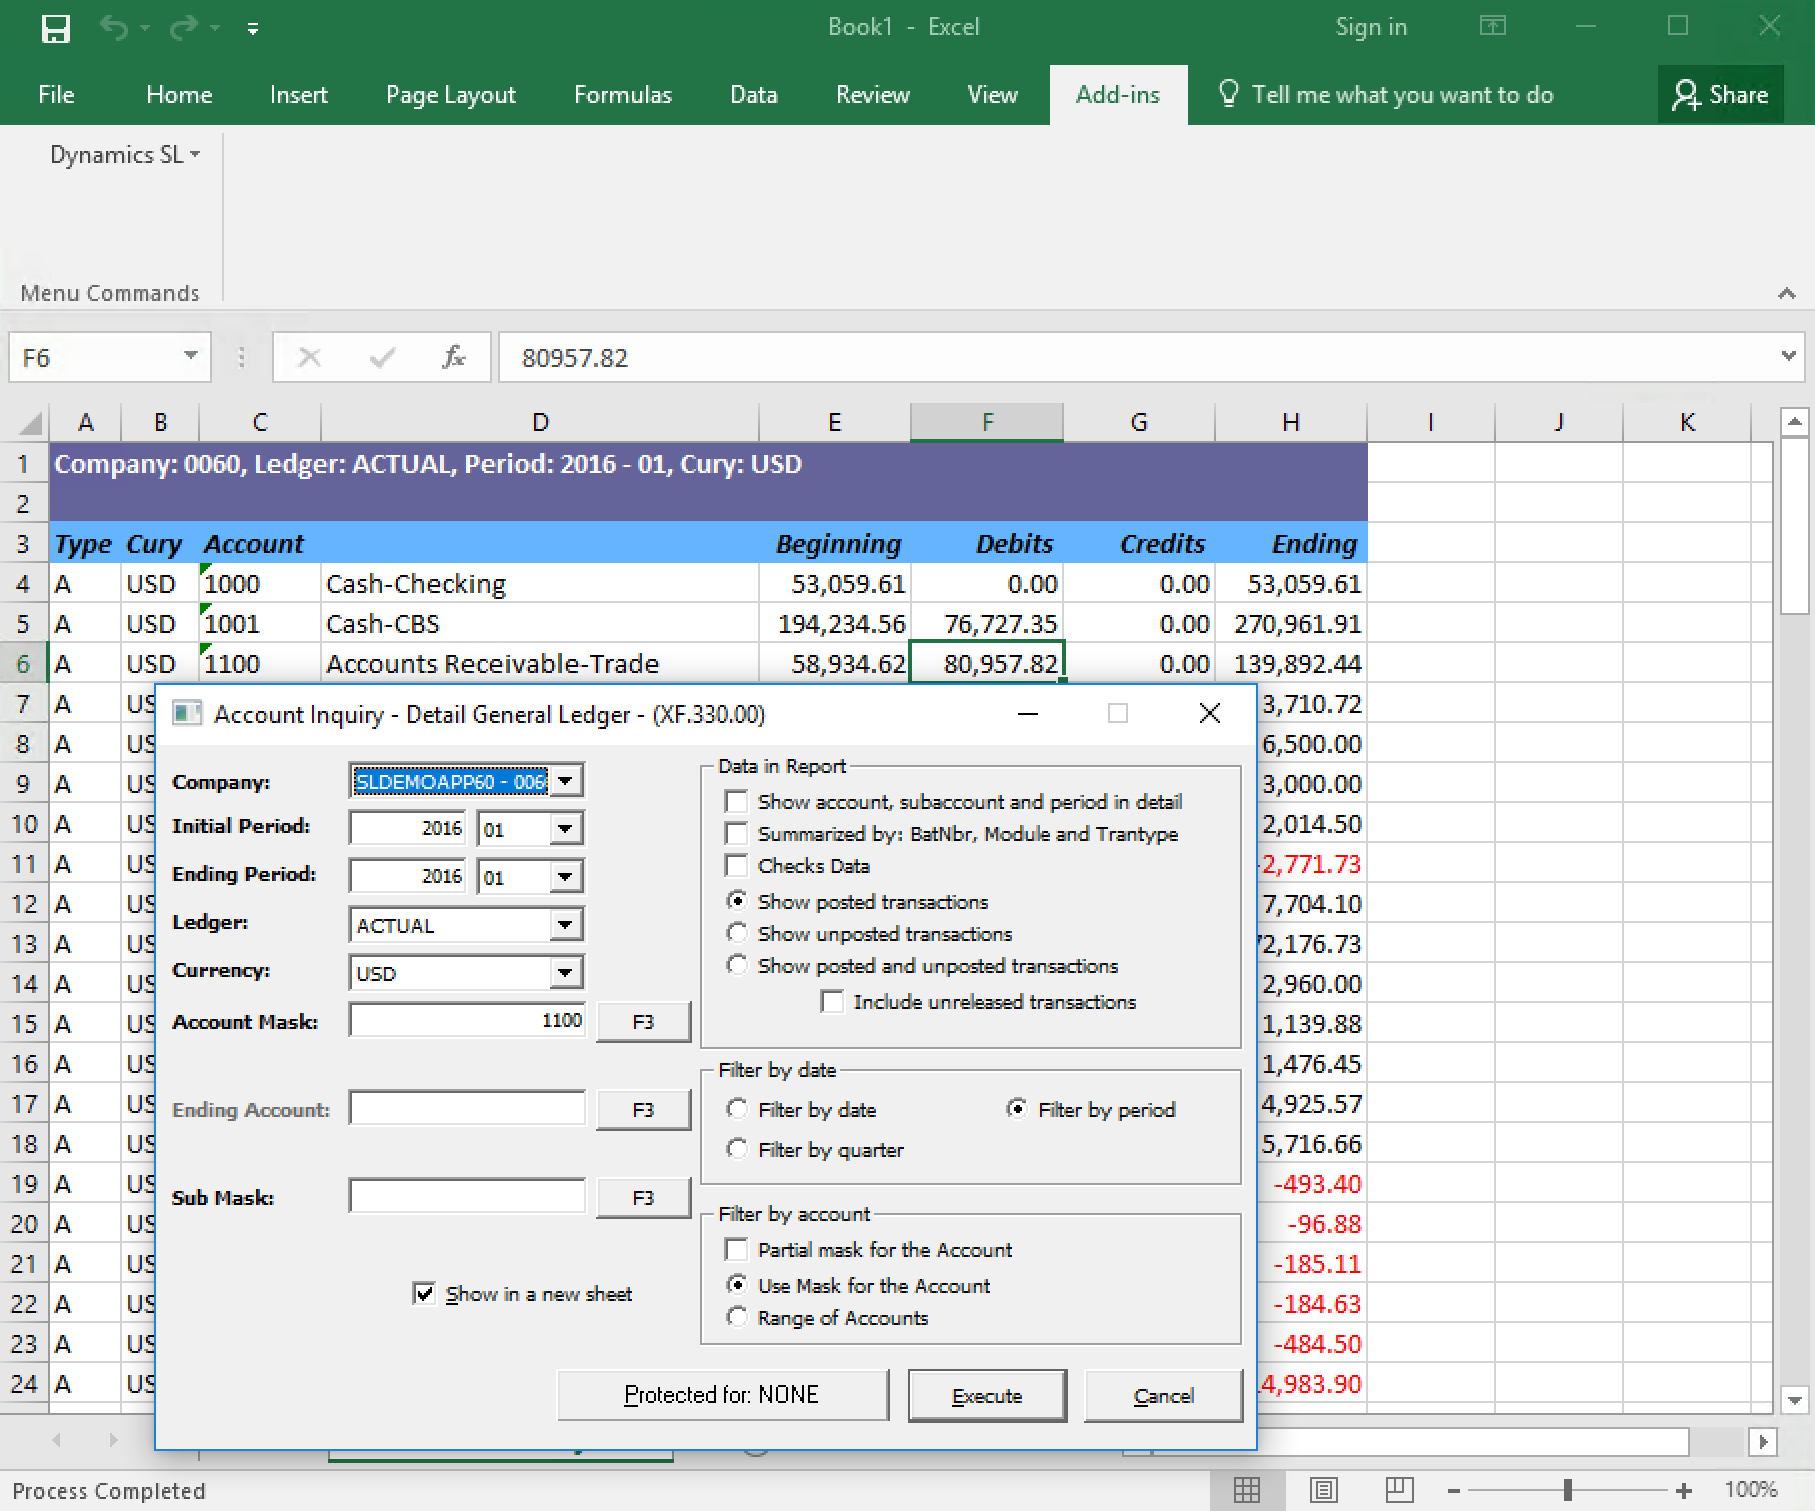
Account Inquiry
This screen provides a spreadsheet with the details of the debits and credits that happen in a given account over a period of time. In the picture, the cell C6 is highlighted, (Account receivables trade) and when the user opens up the Account Inquiry, it reads the period, the account, the book, etc, so it can provide the details or “drill down” of the amount.
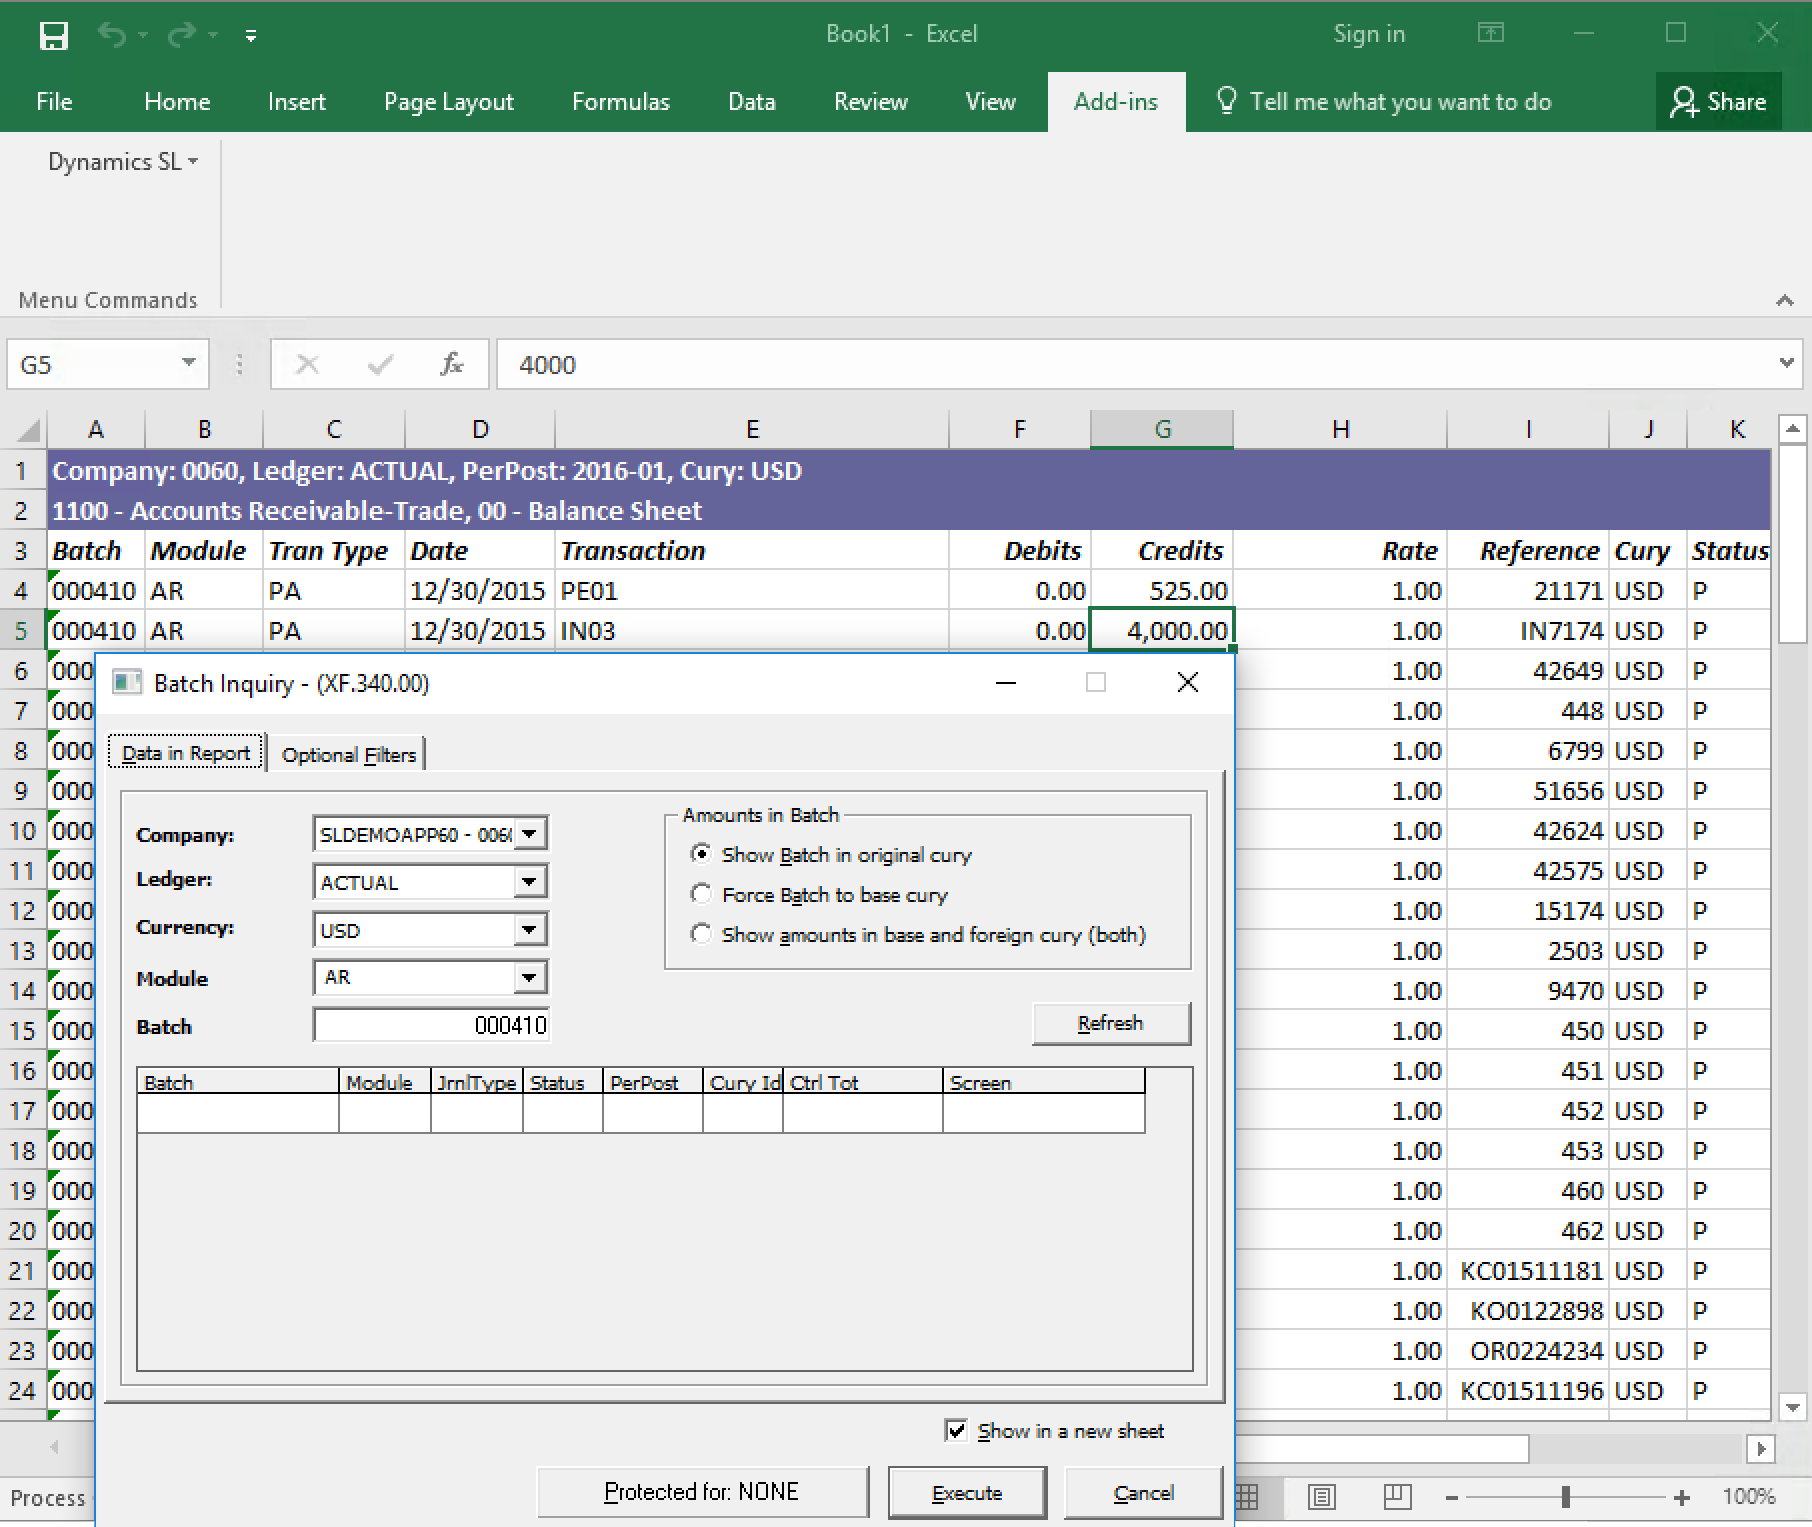
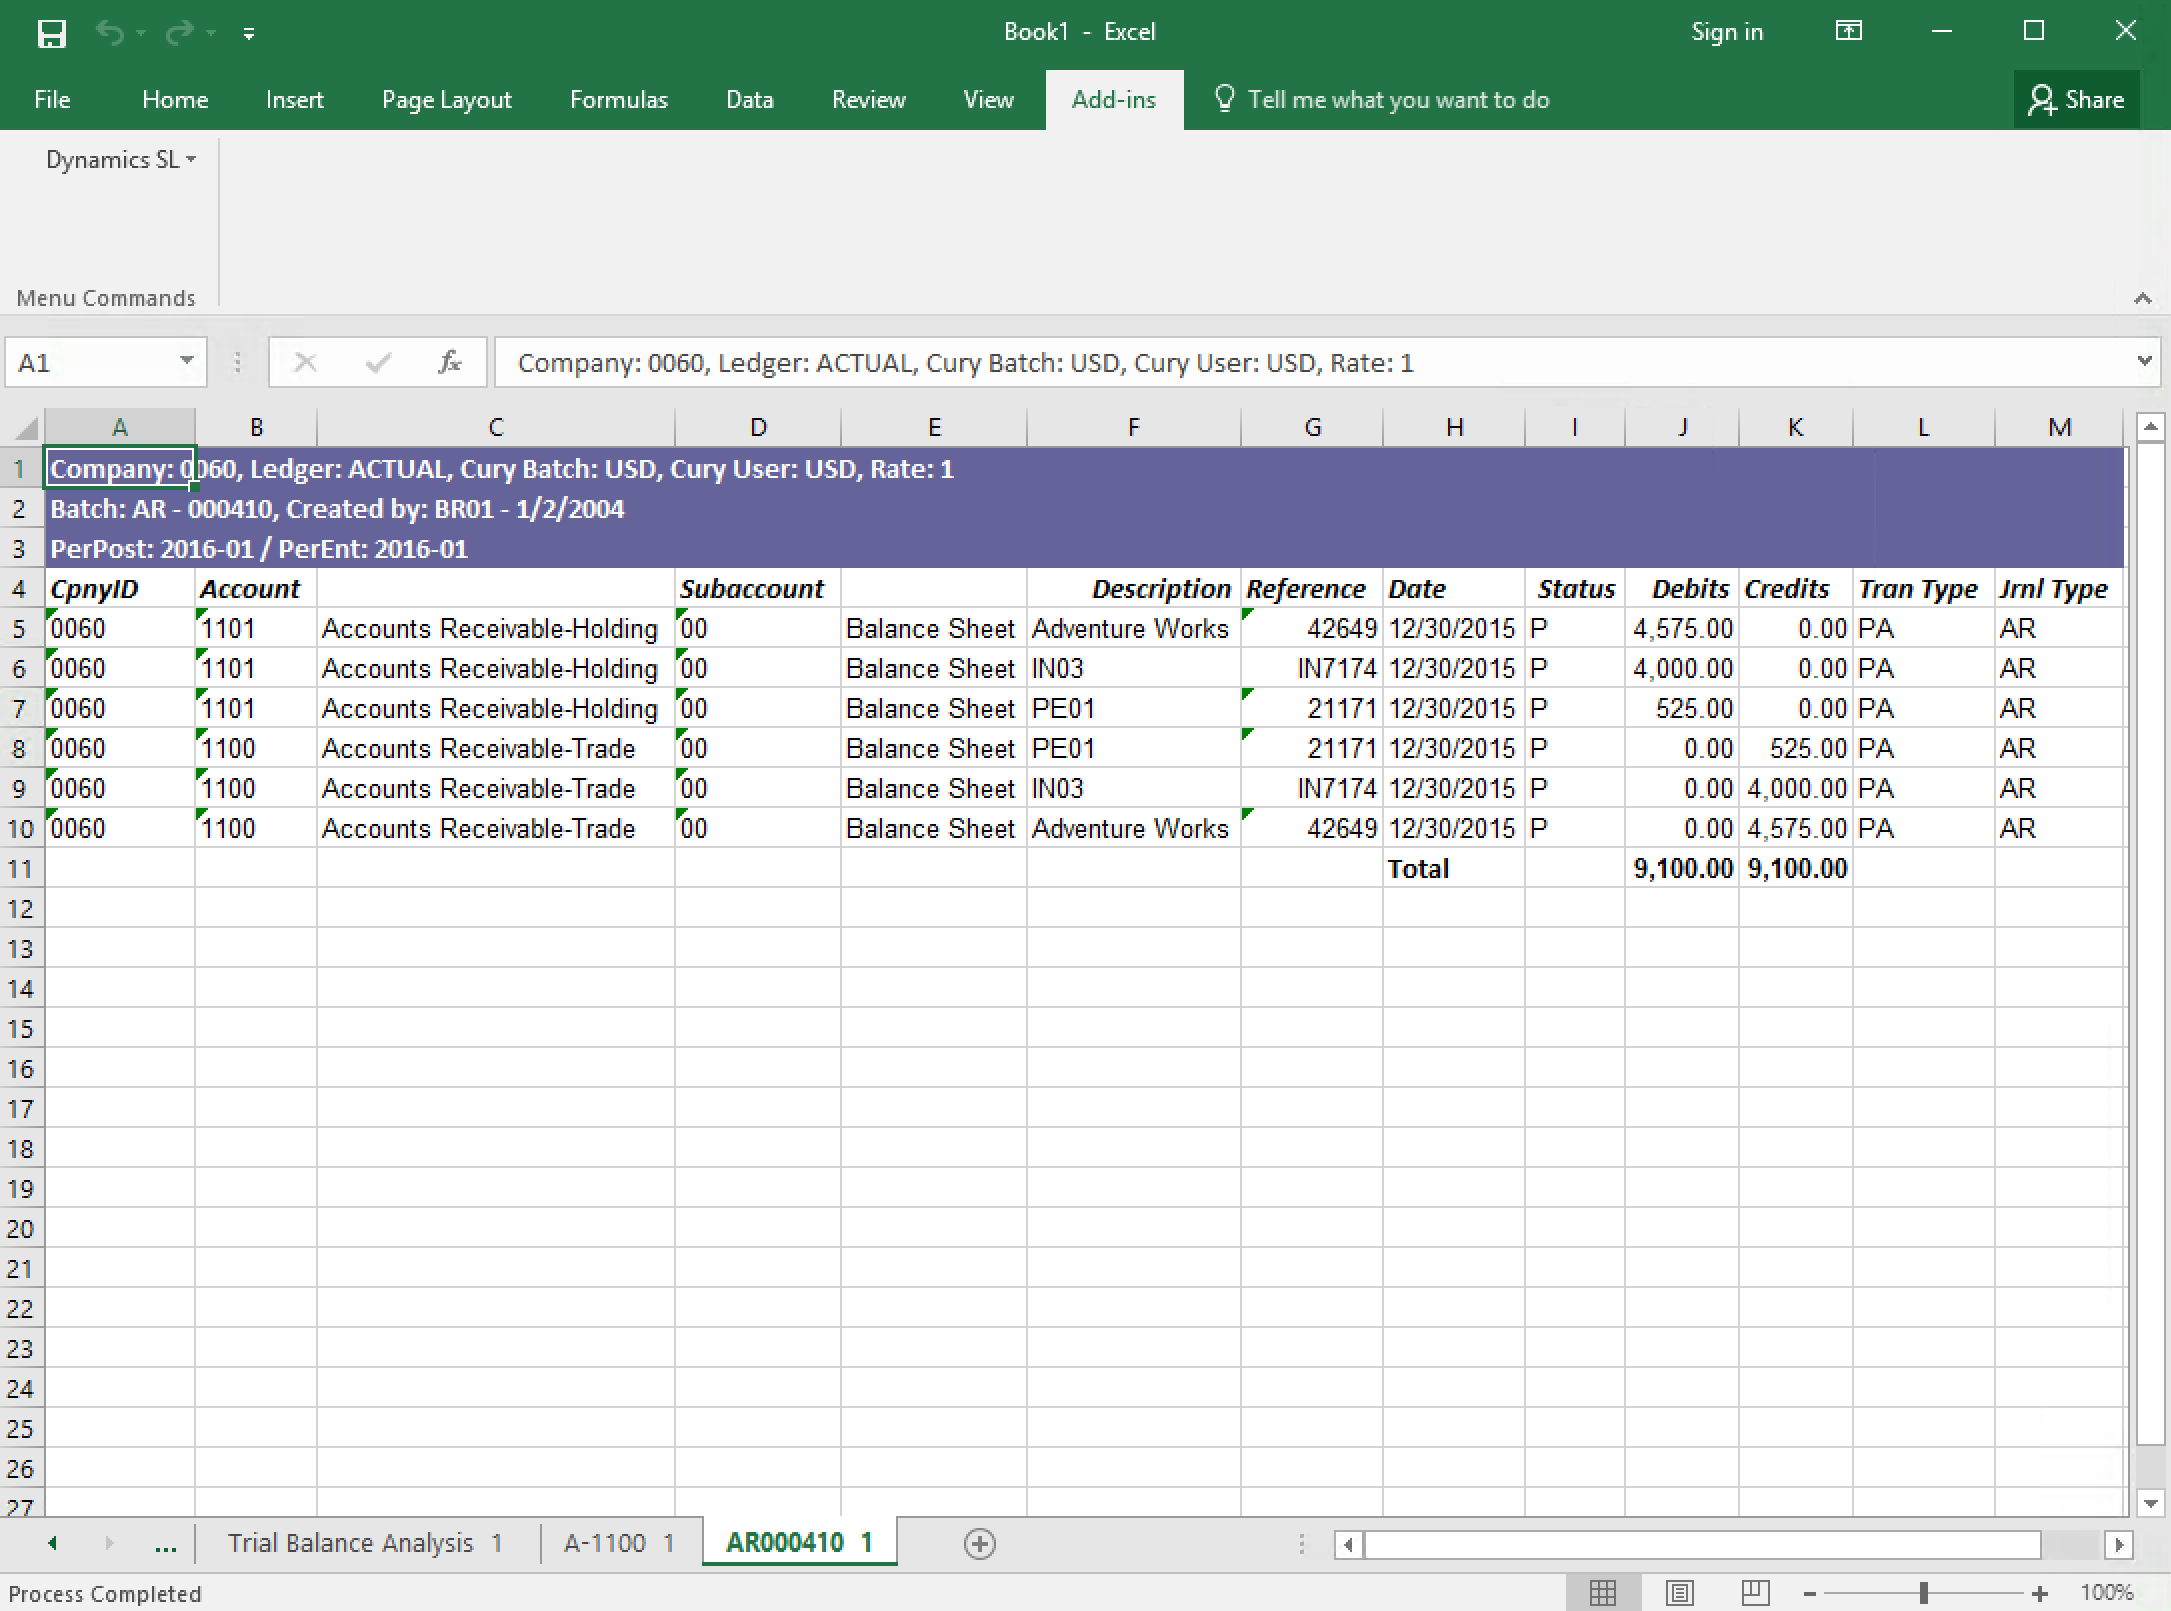
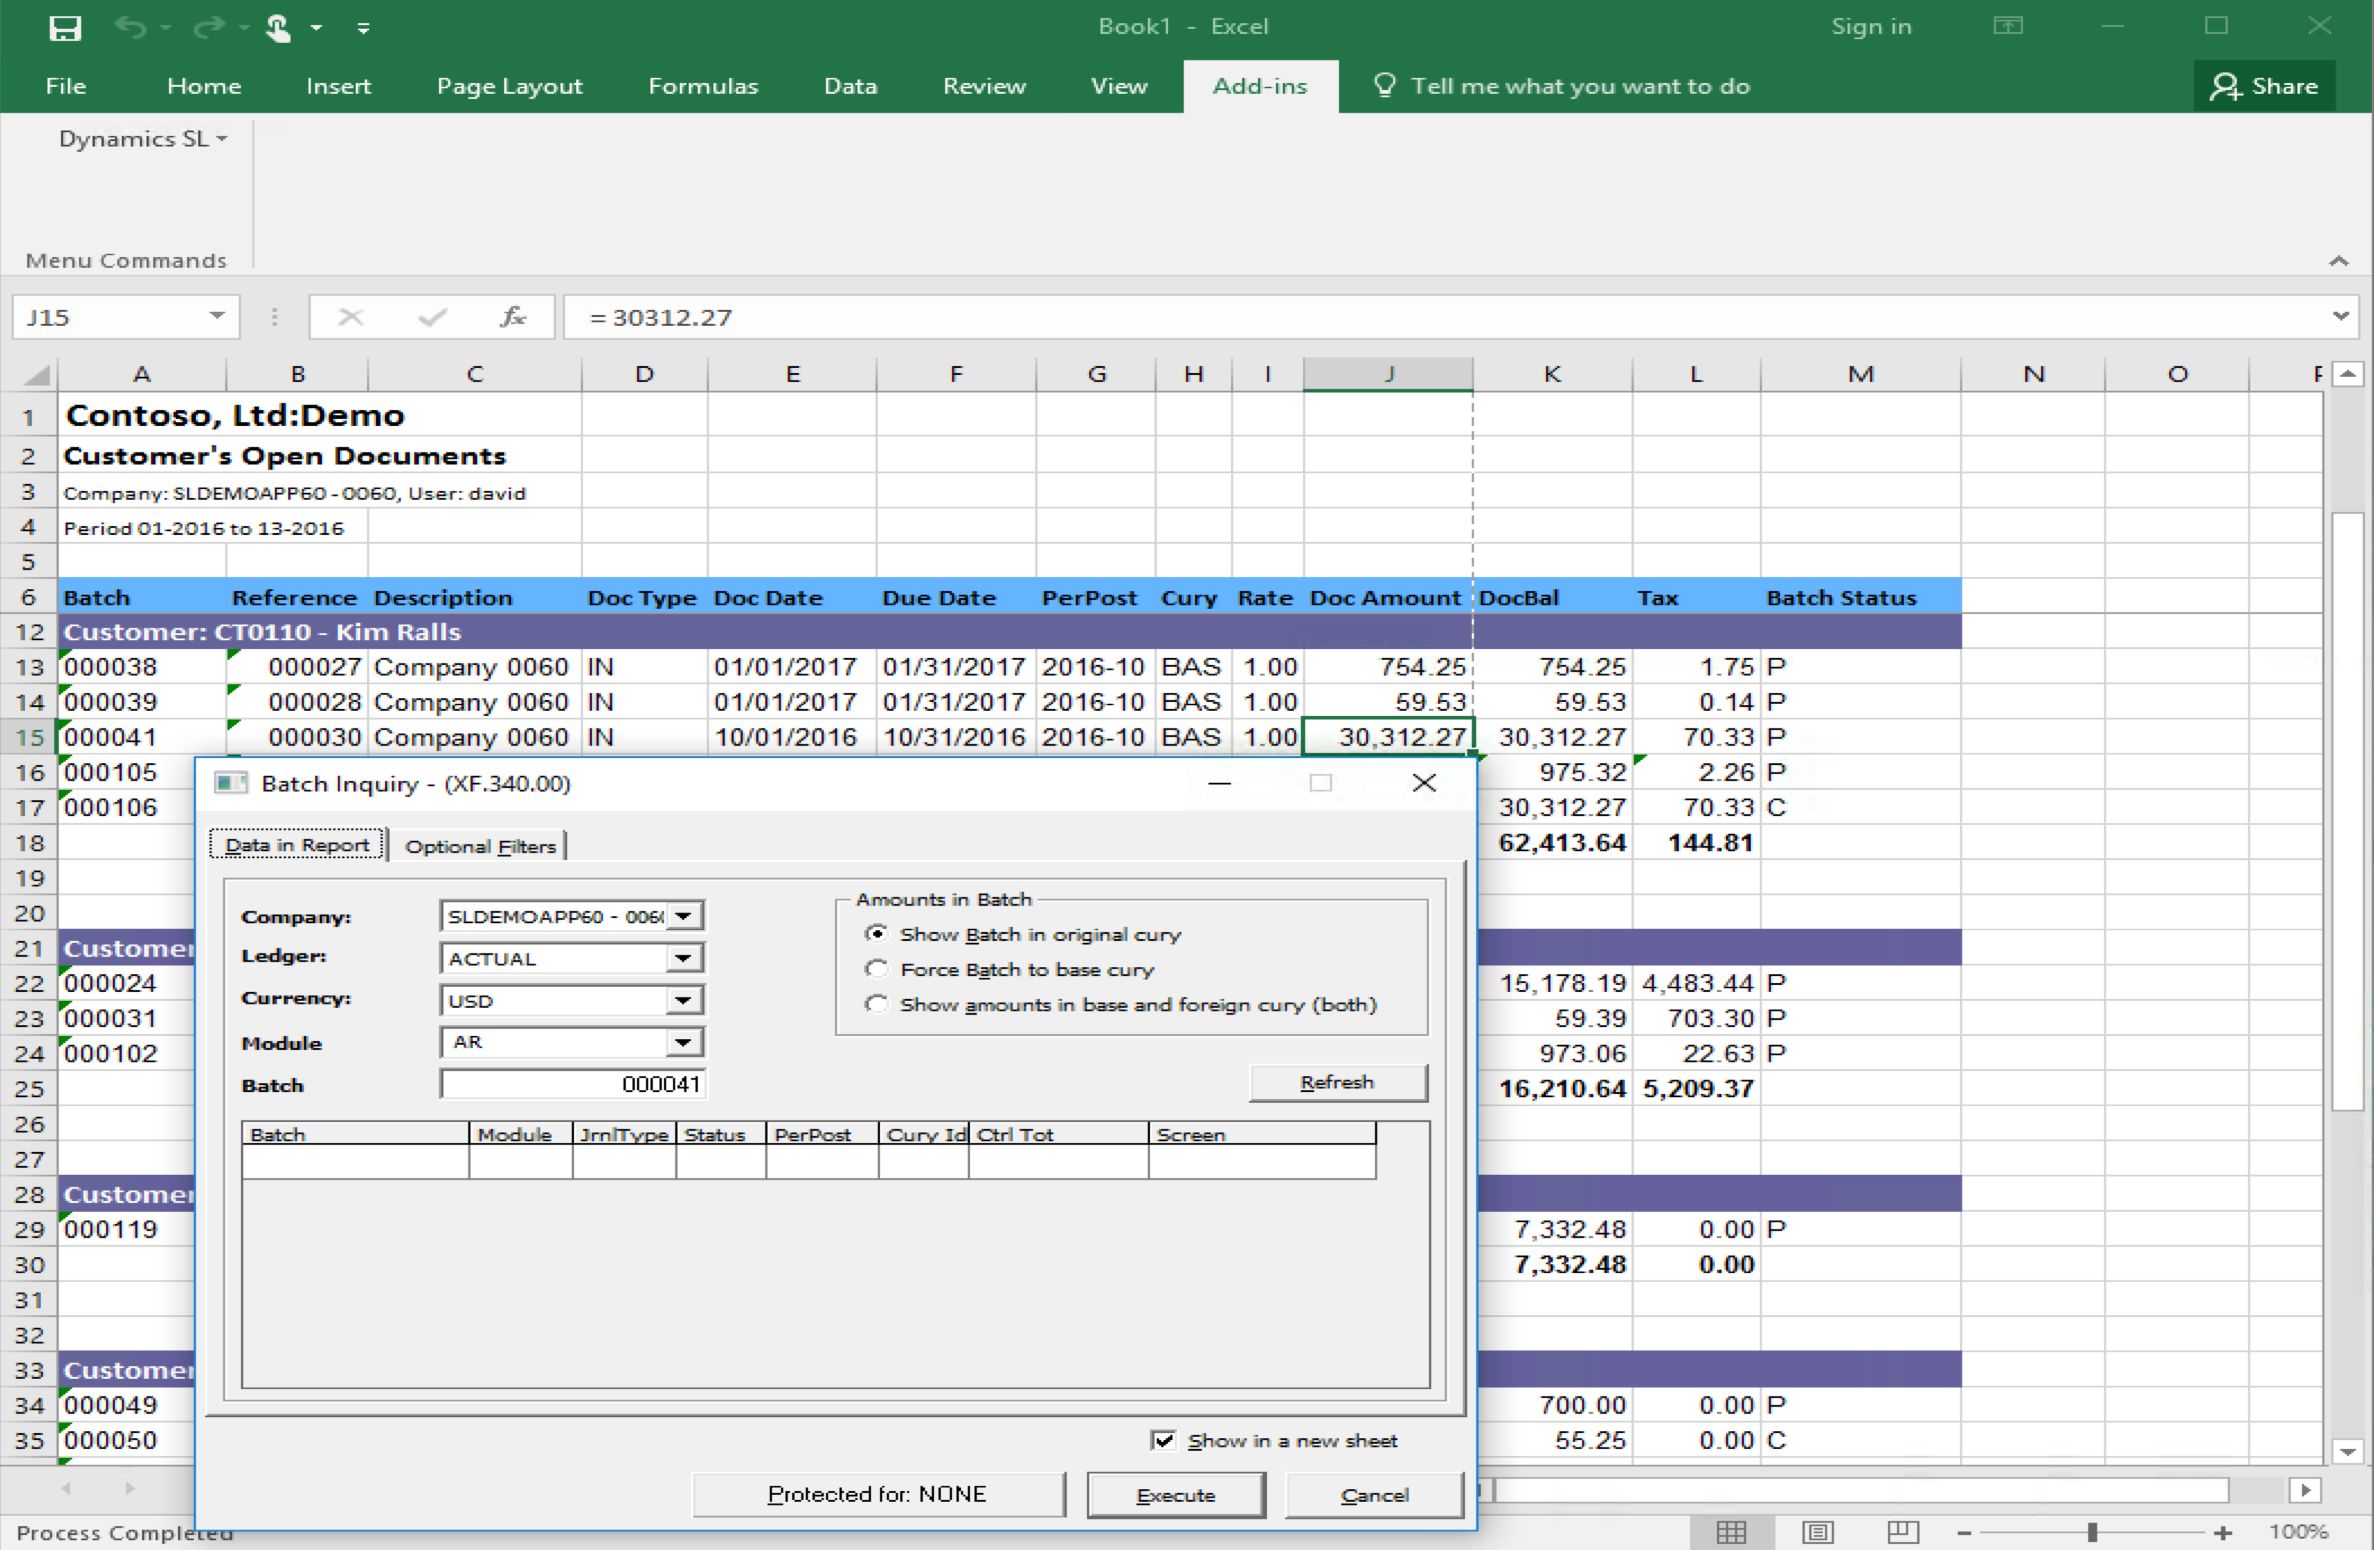
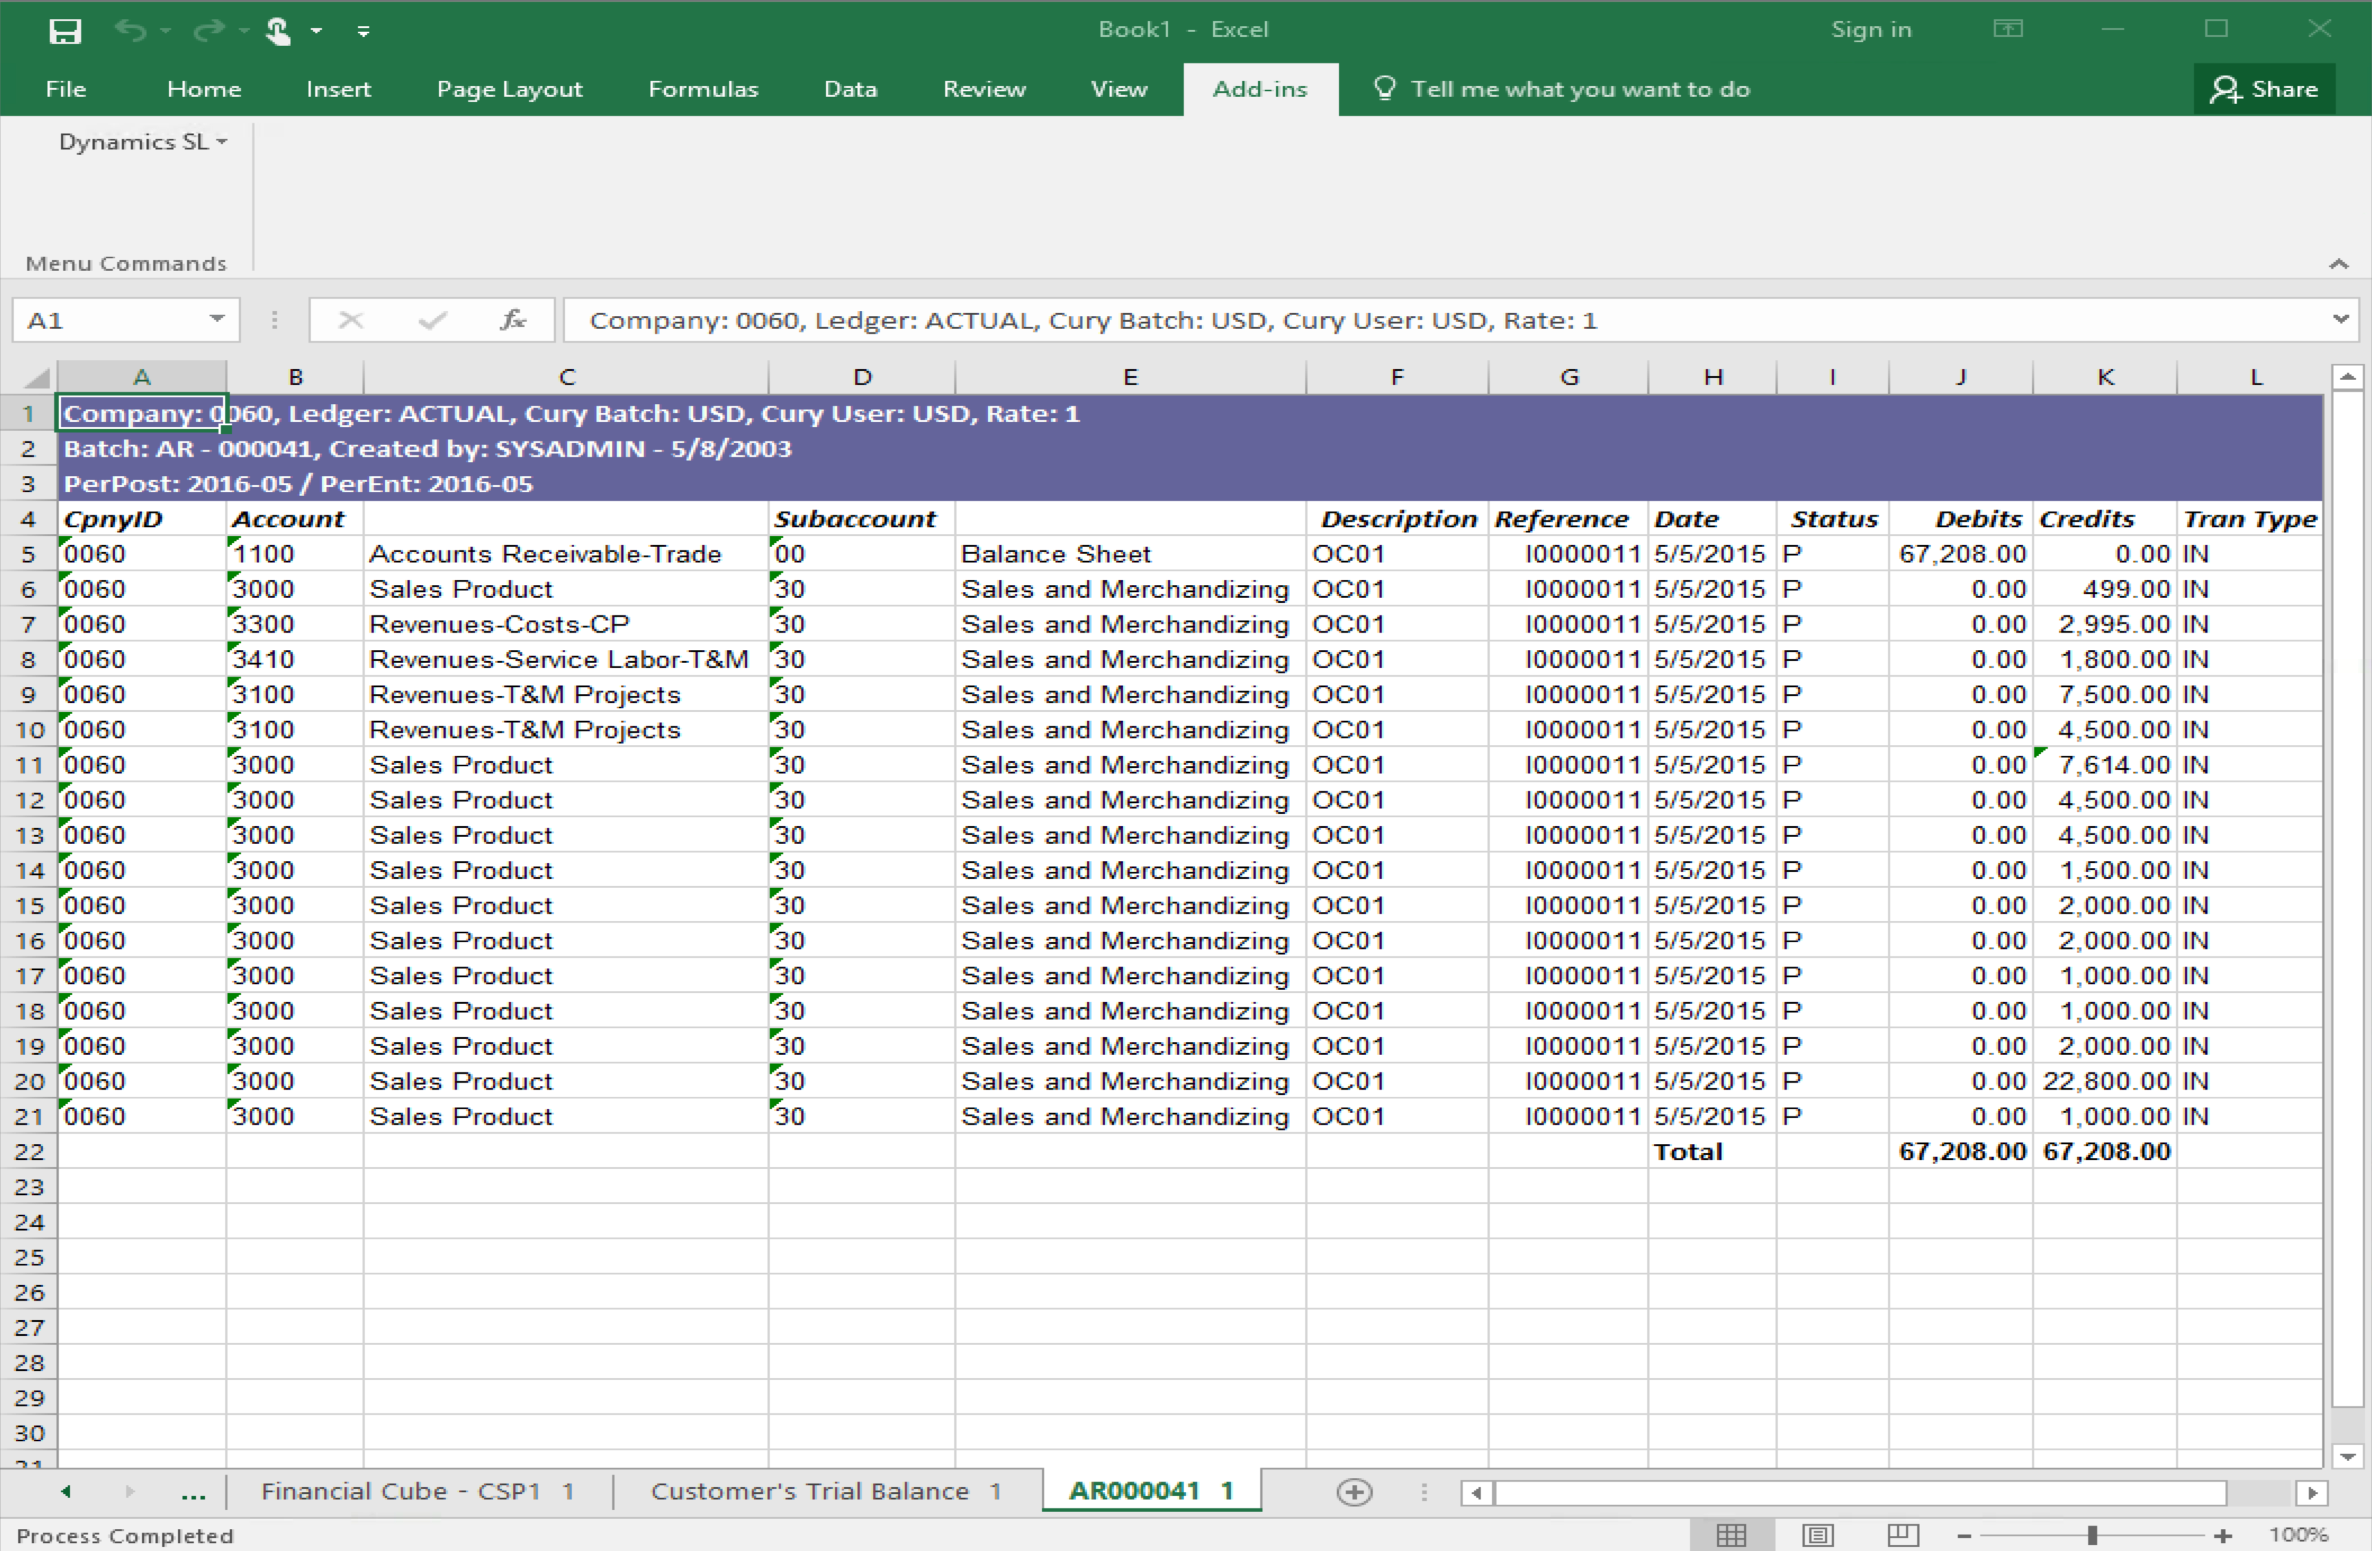
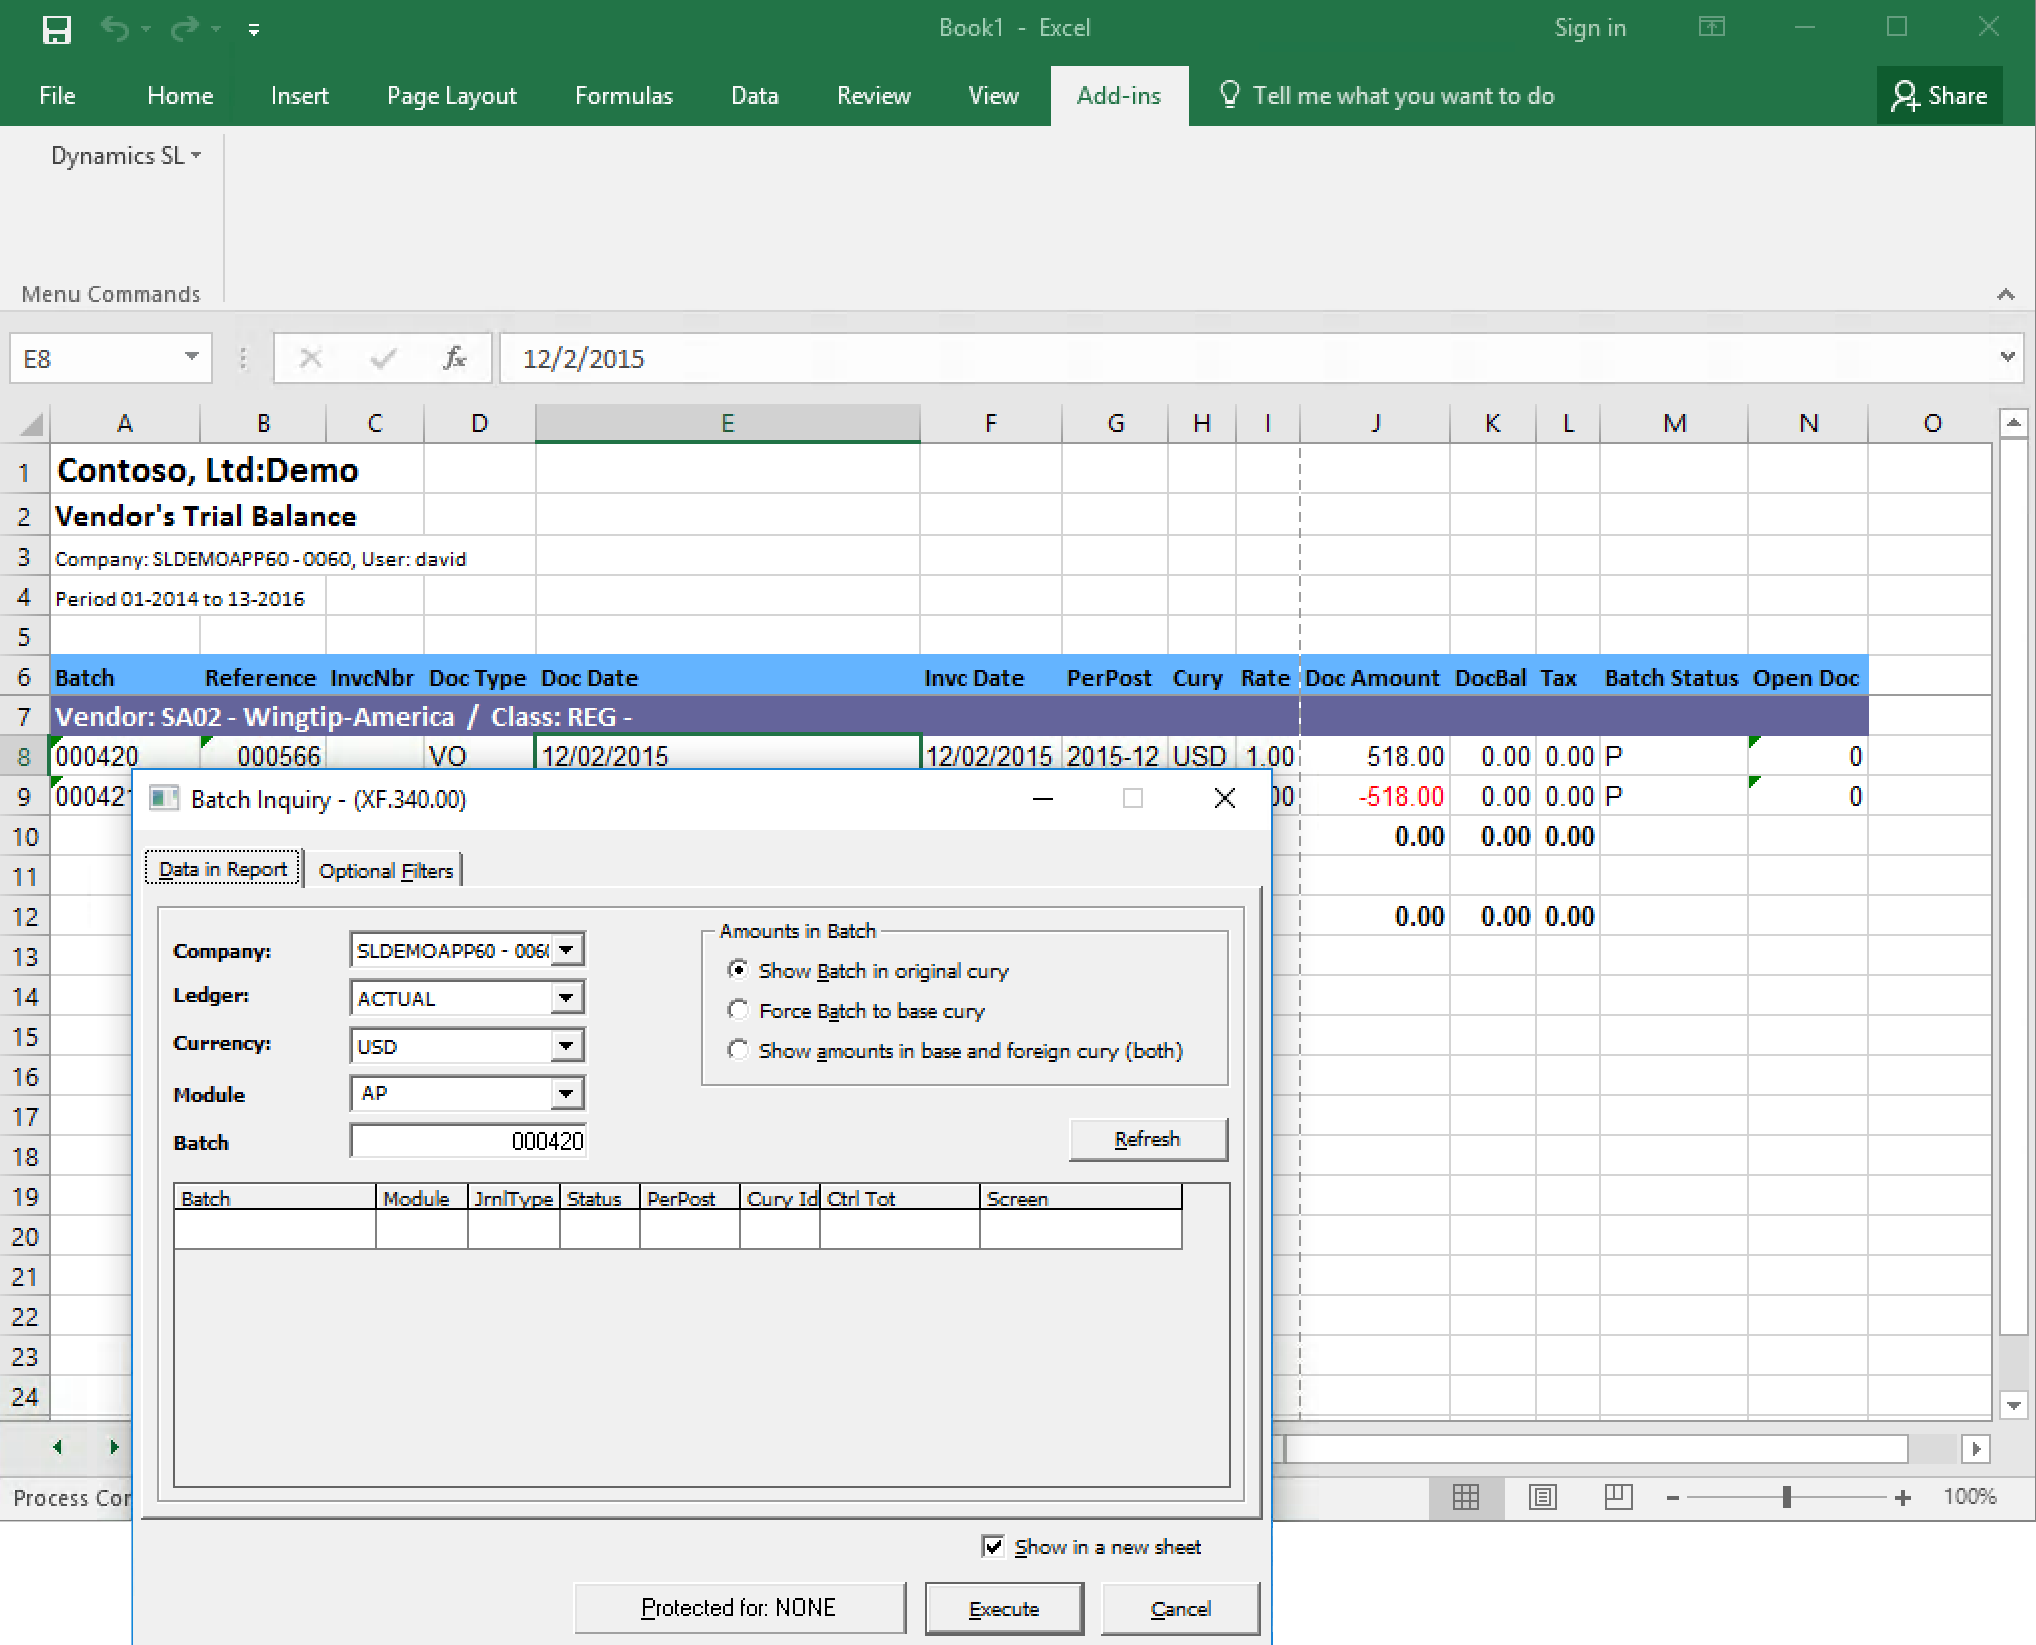
Batch (Document) inquiry
This screen will provide the user with a new spreadsheet with the details of the document or batch number. In the picture, cell G5 is highlighted ($4000) and the user open the Batch Inquiry. XL Analyzer automatically detects the Batch Number, Module, etc, so the right batch can be displayed in a new spreadsheet.
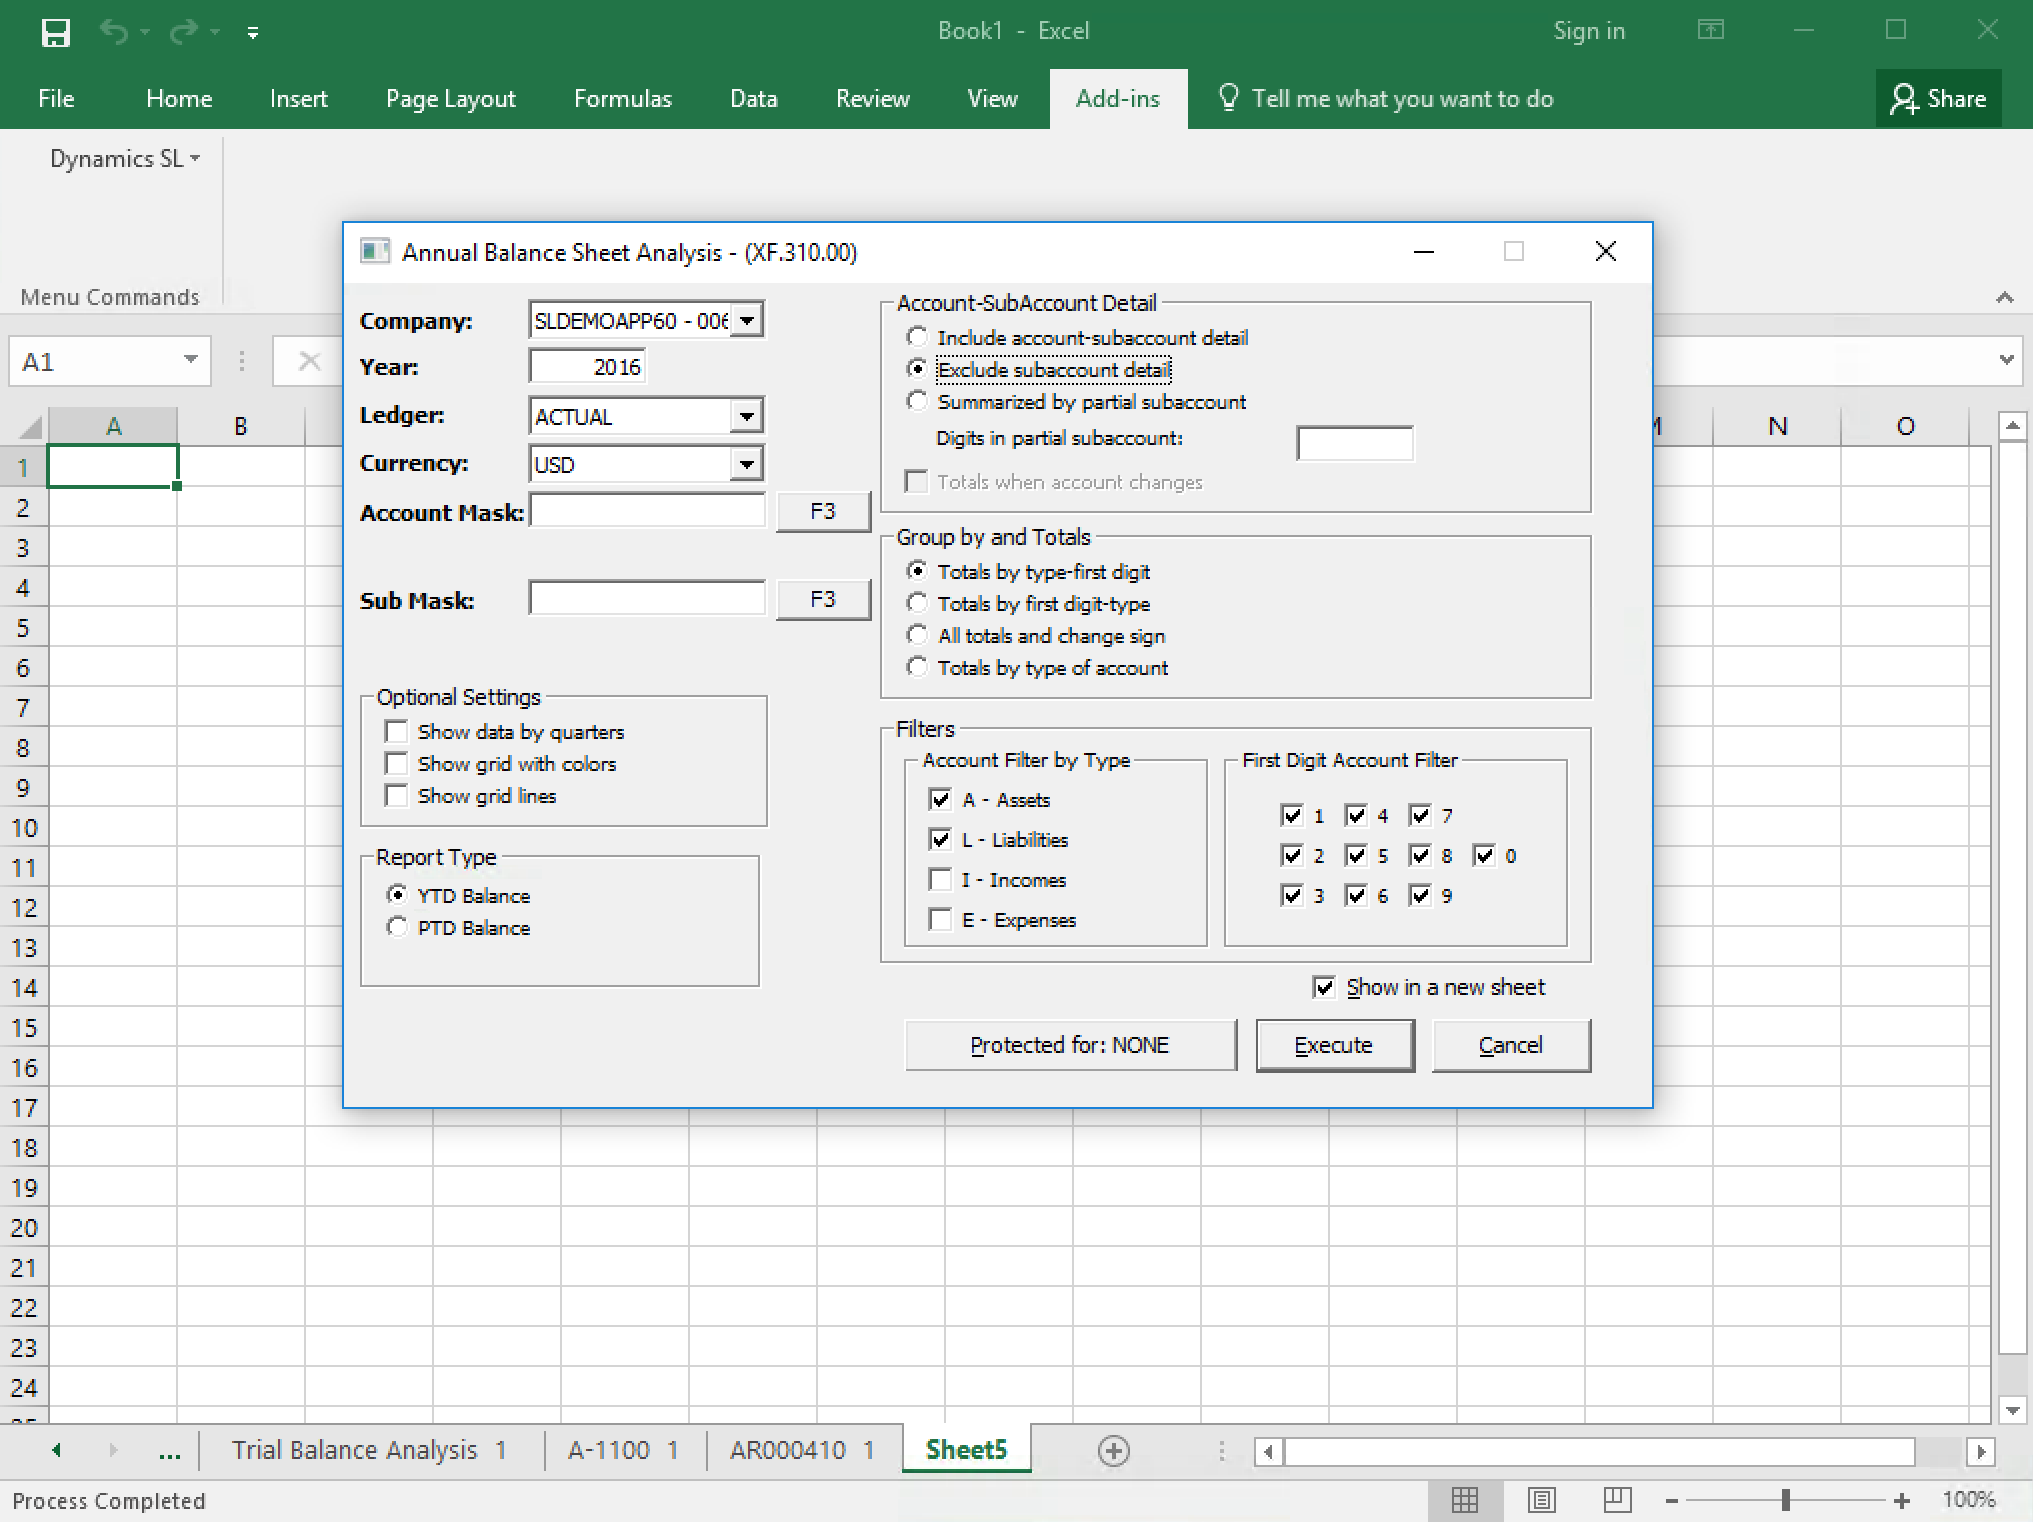
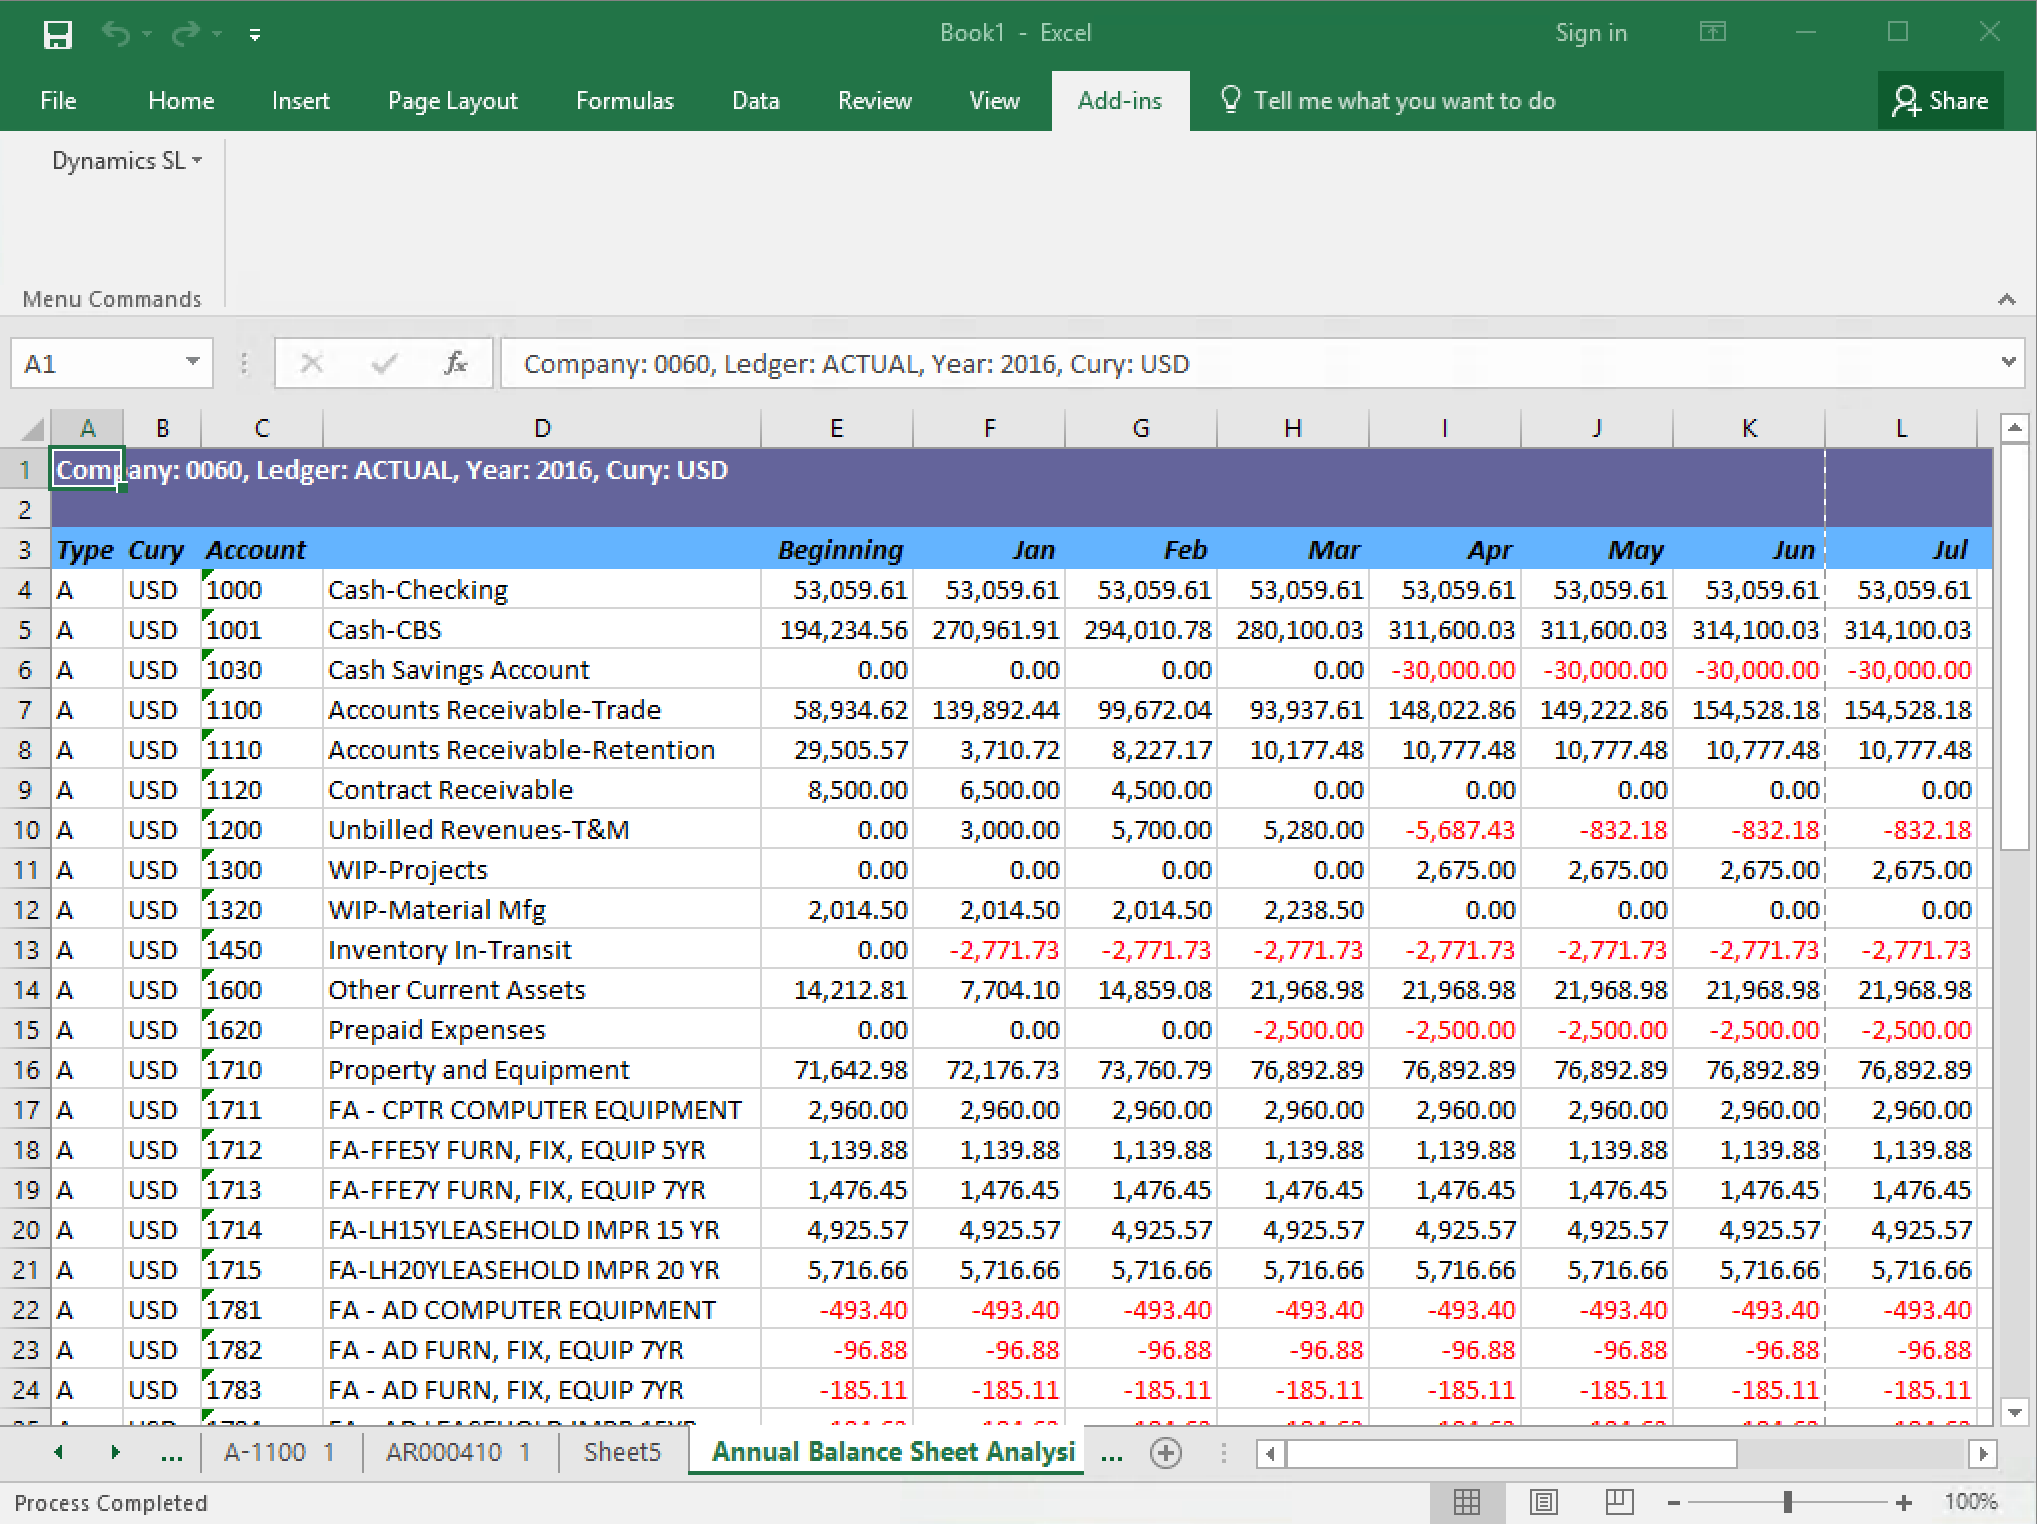
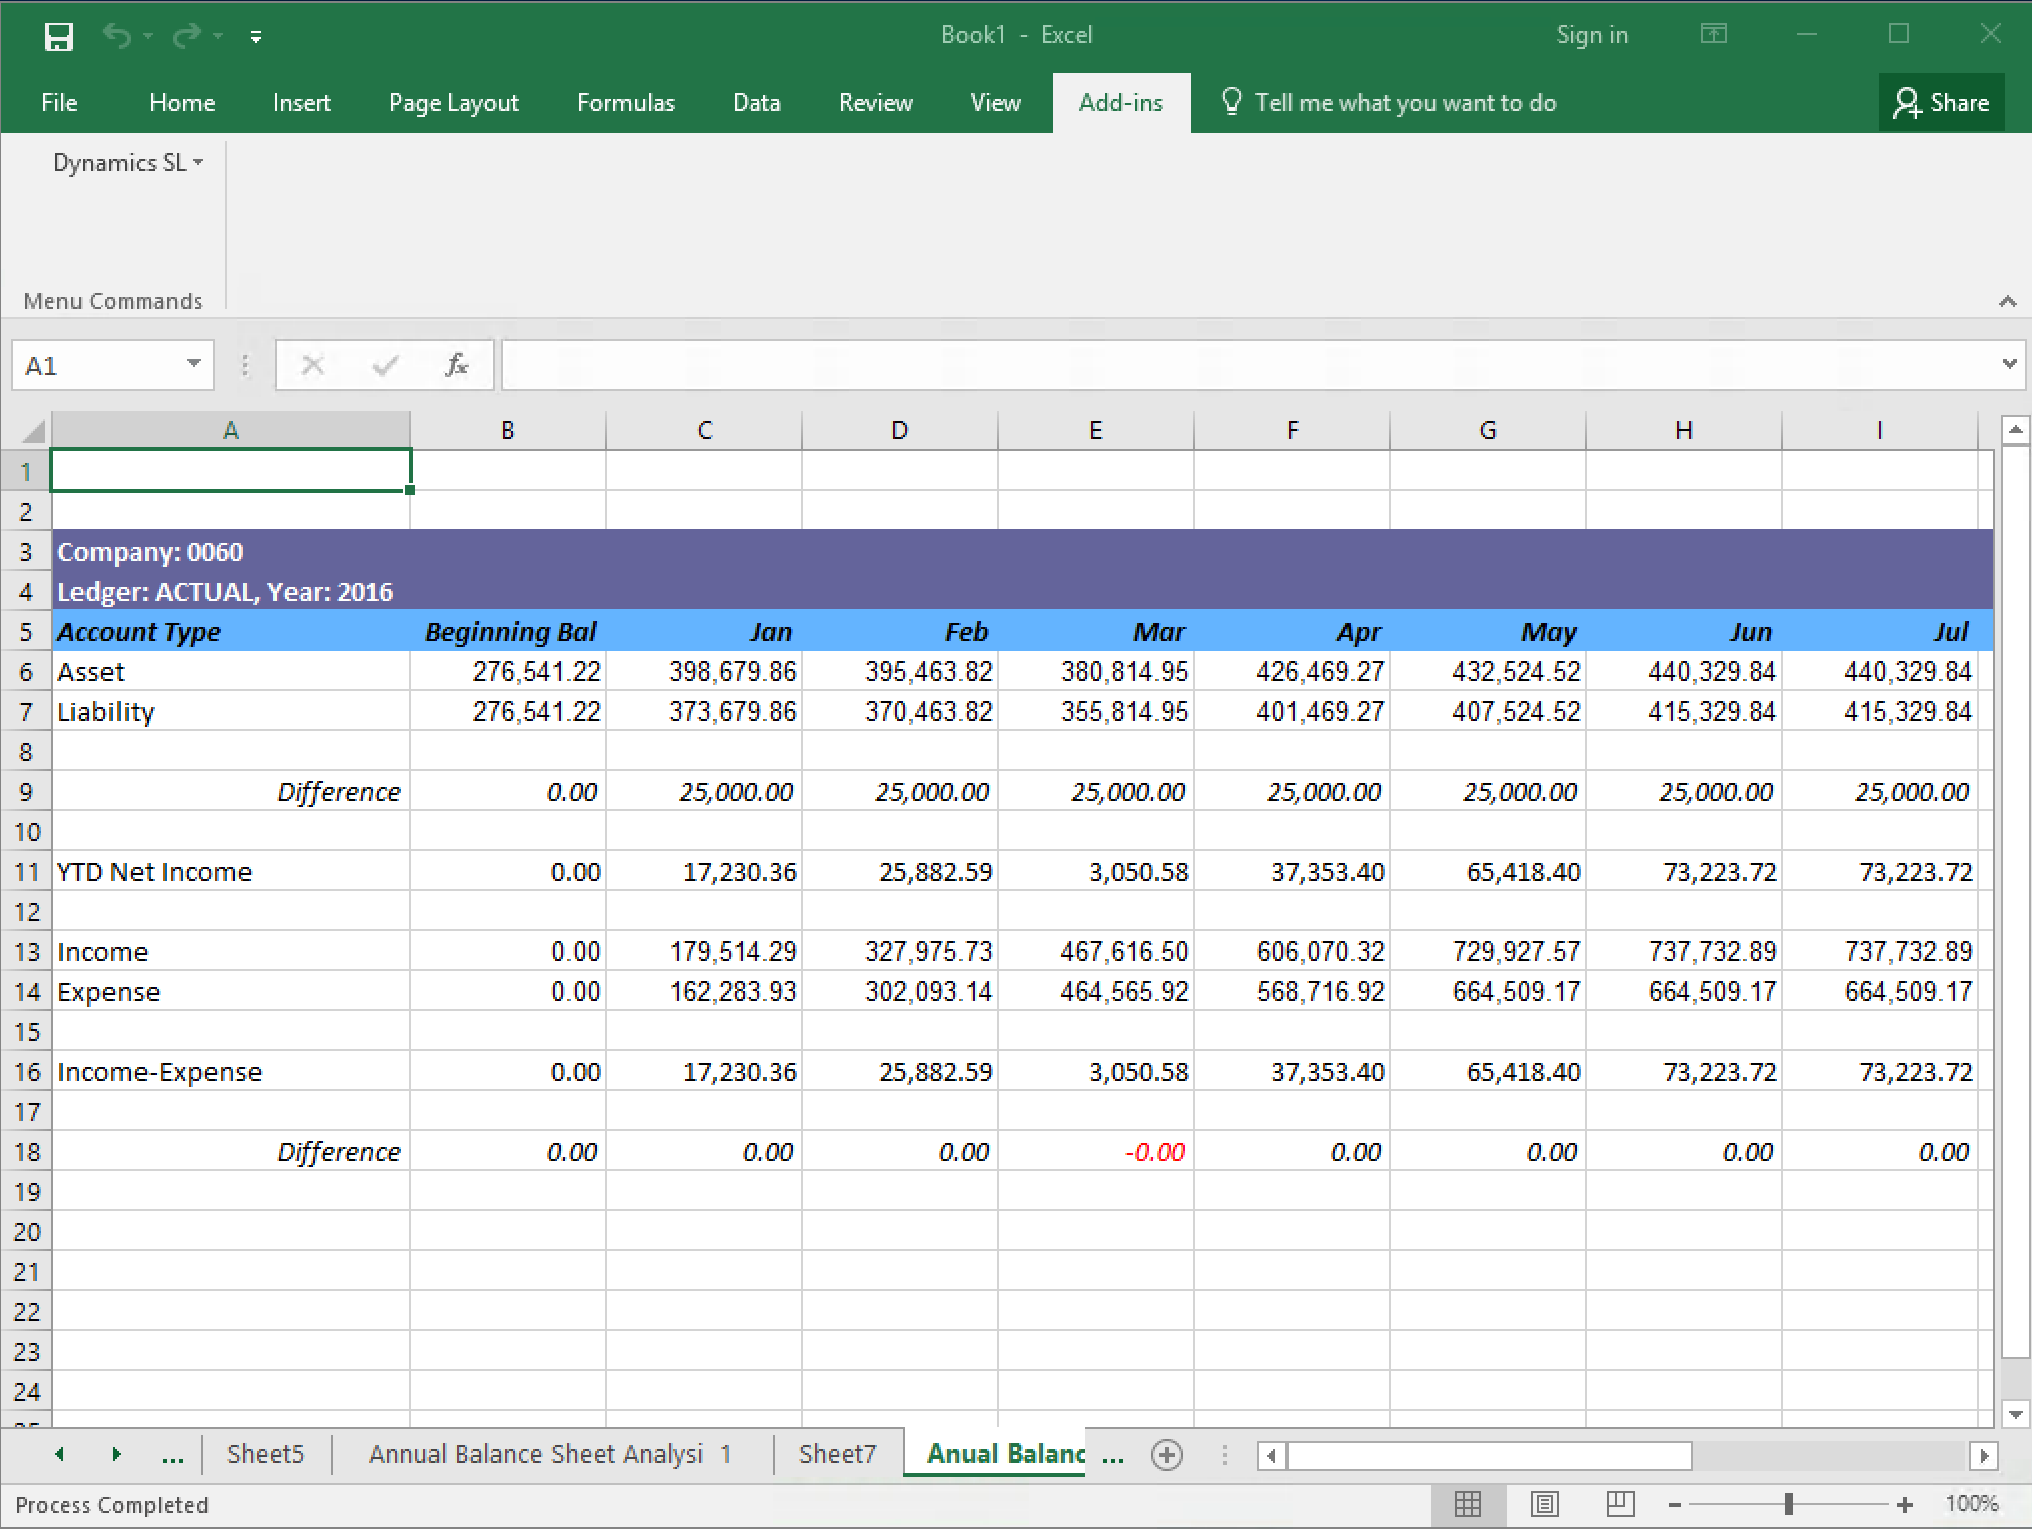
Annual Balance Sheet
This report is very useful in the process of closing periods of fiscal years. Provides the ability to notice variations months to moths, or spotting amounts that don’t make sense. From here users can just highlight the amount and open Account Inquiry to drill down, and then maybe Batch detail.
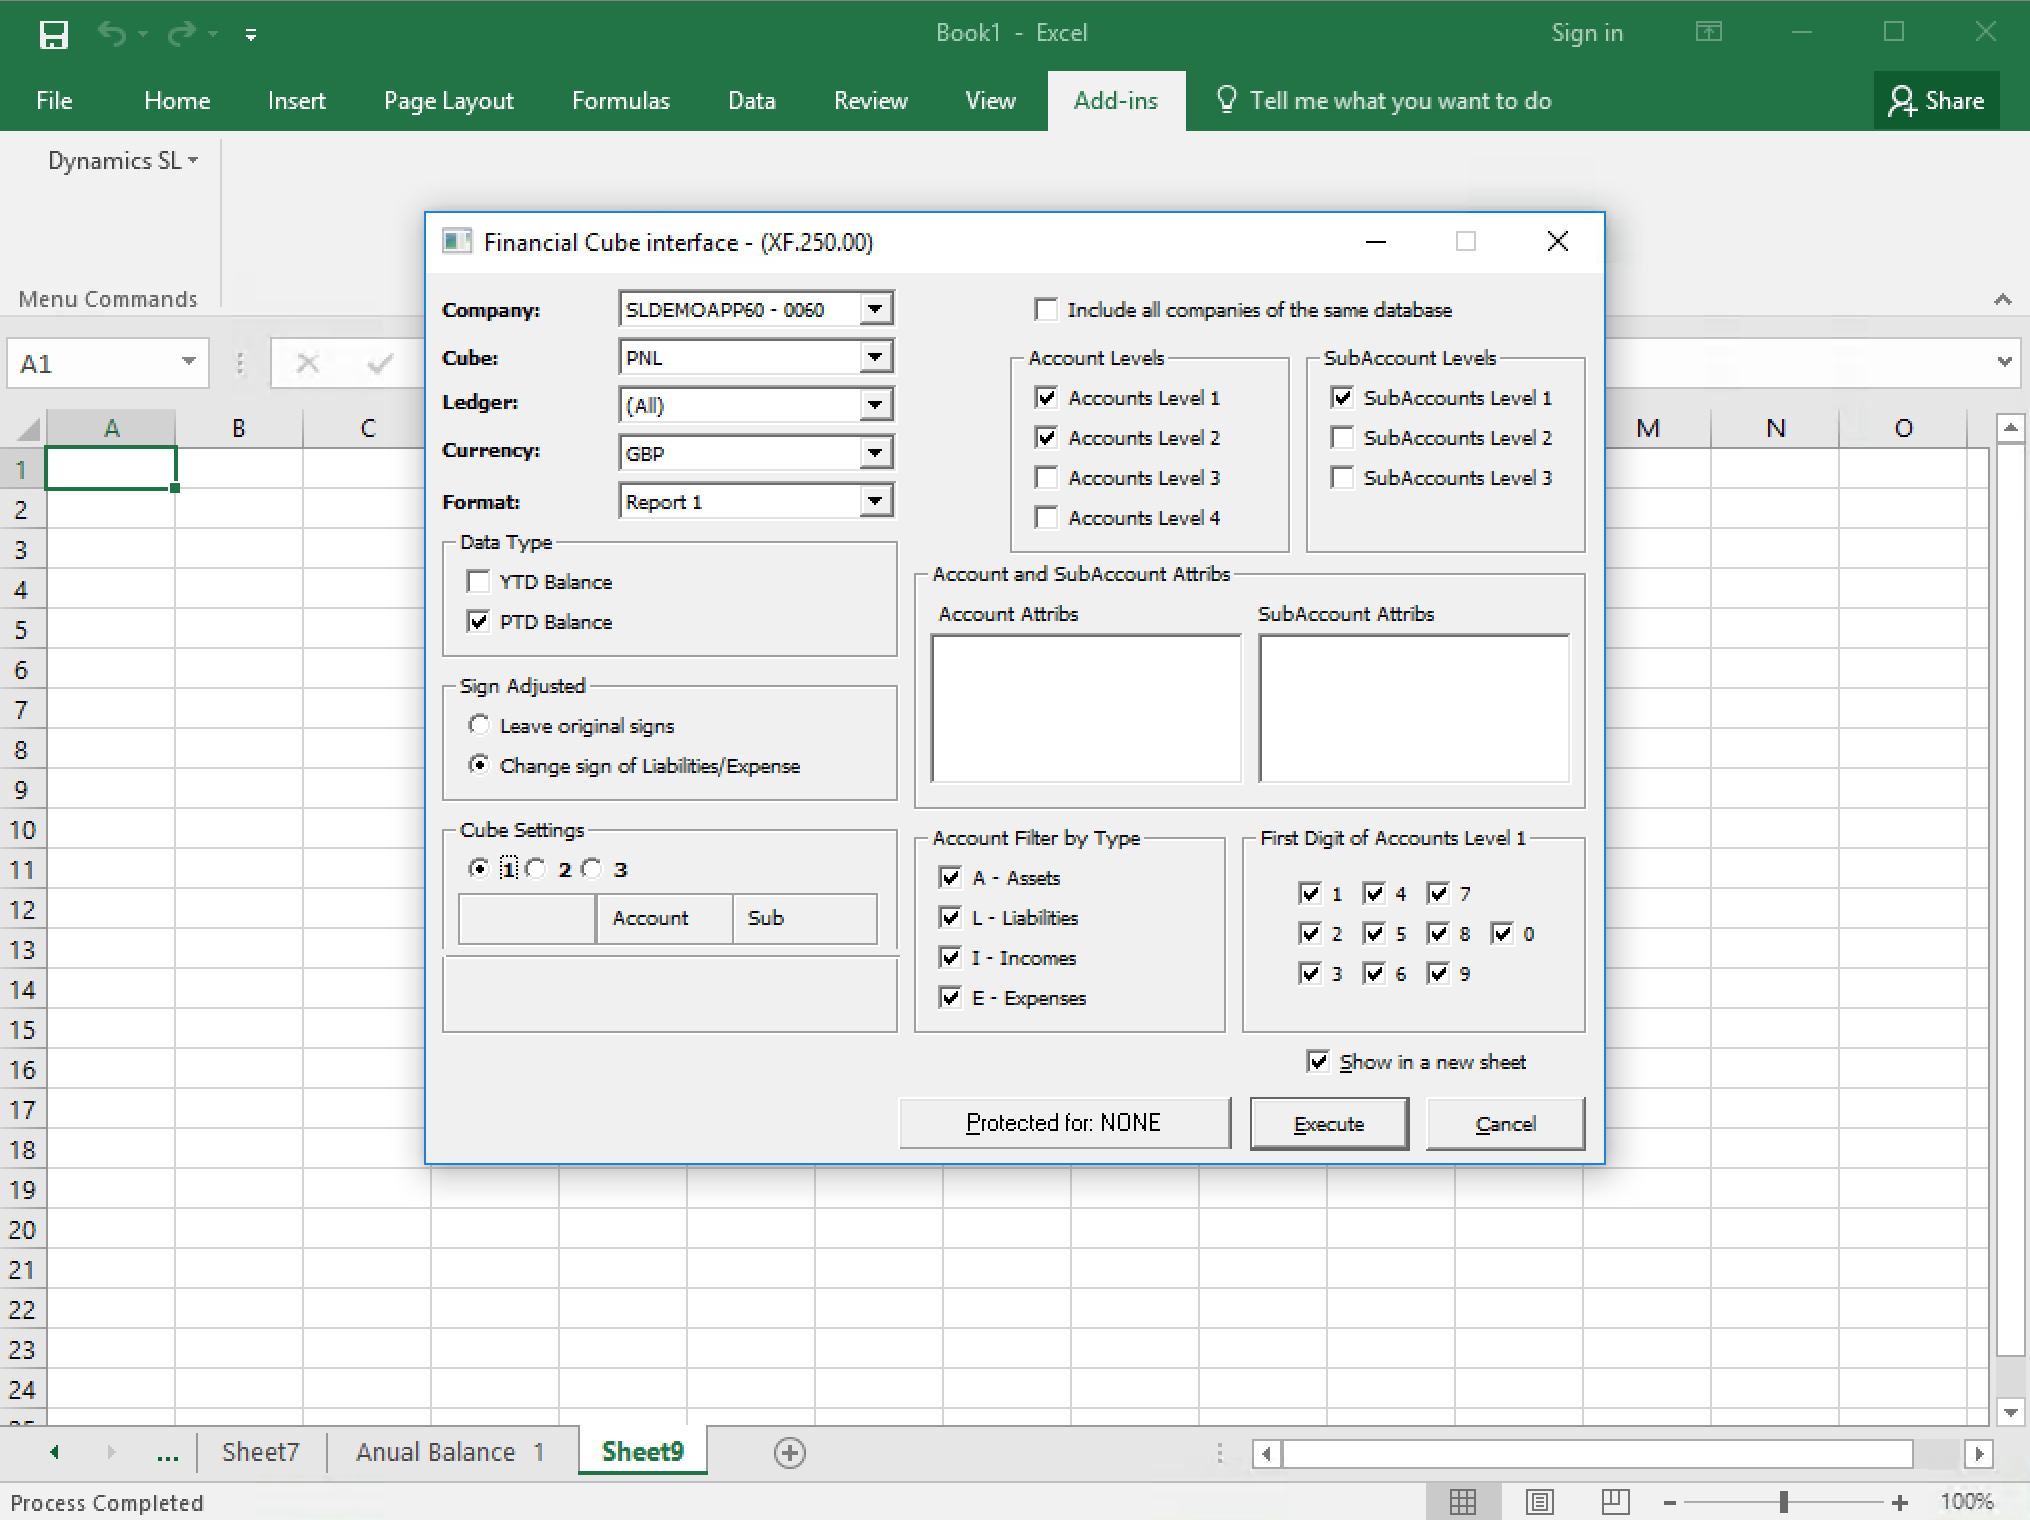
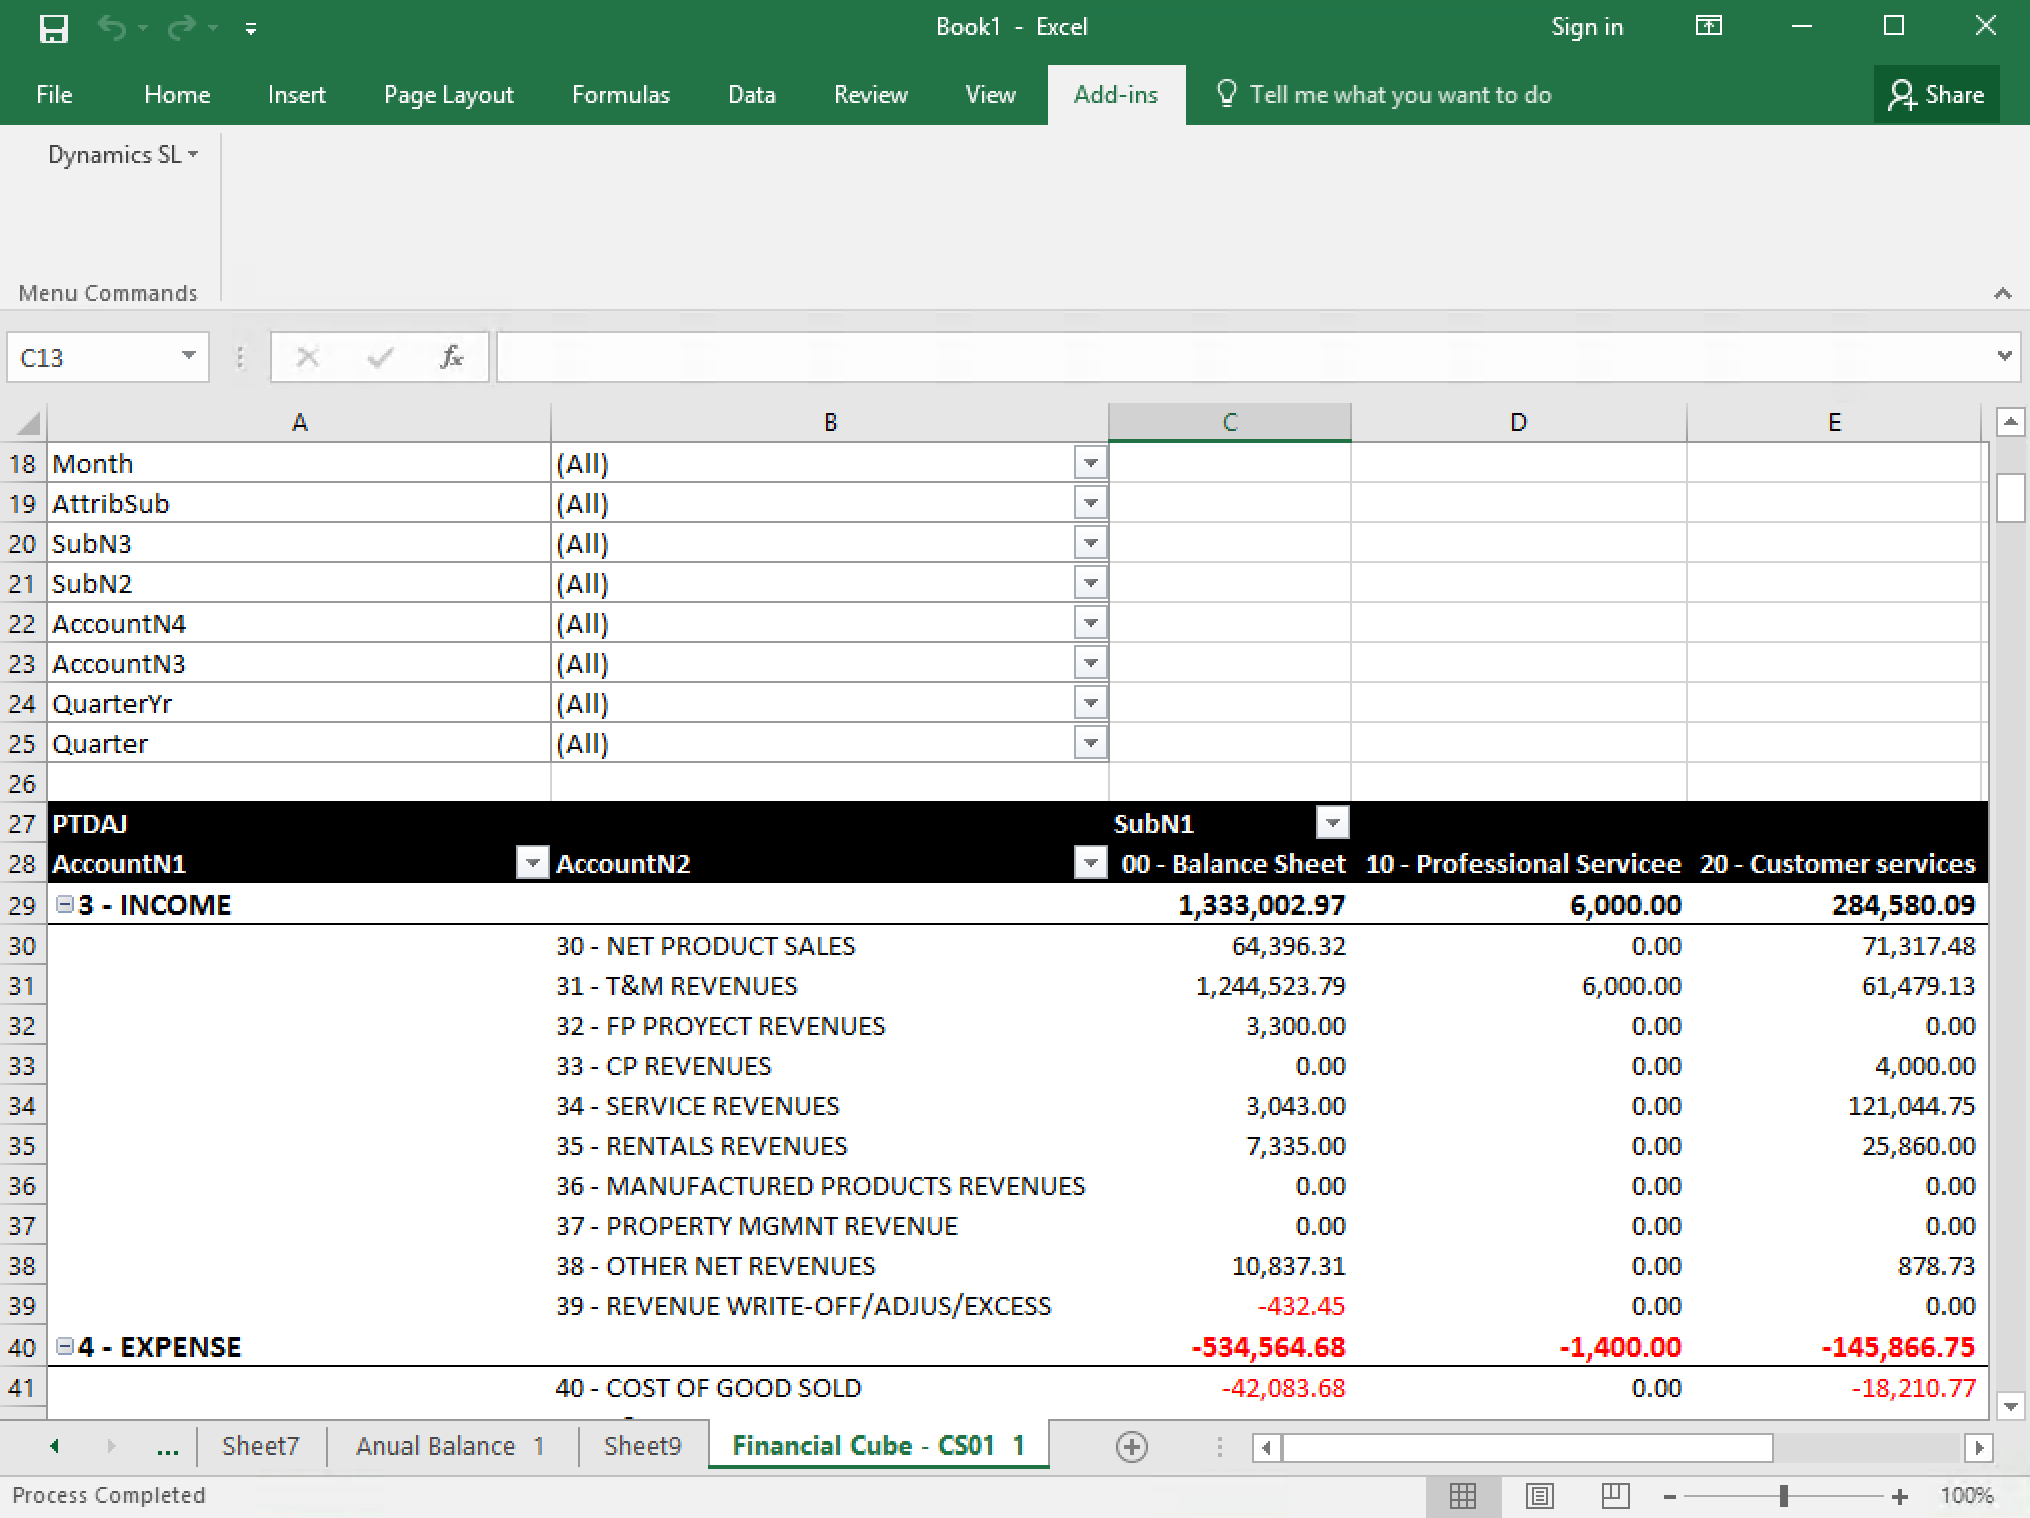
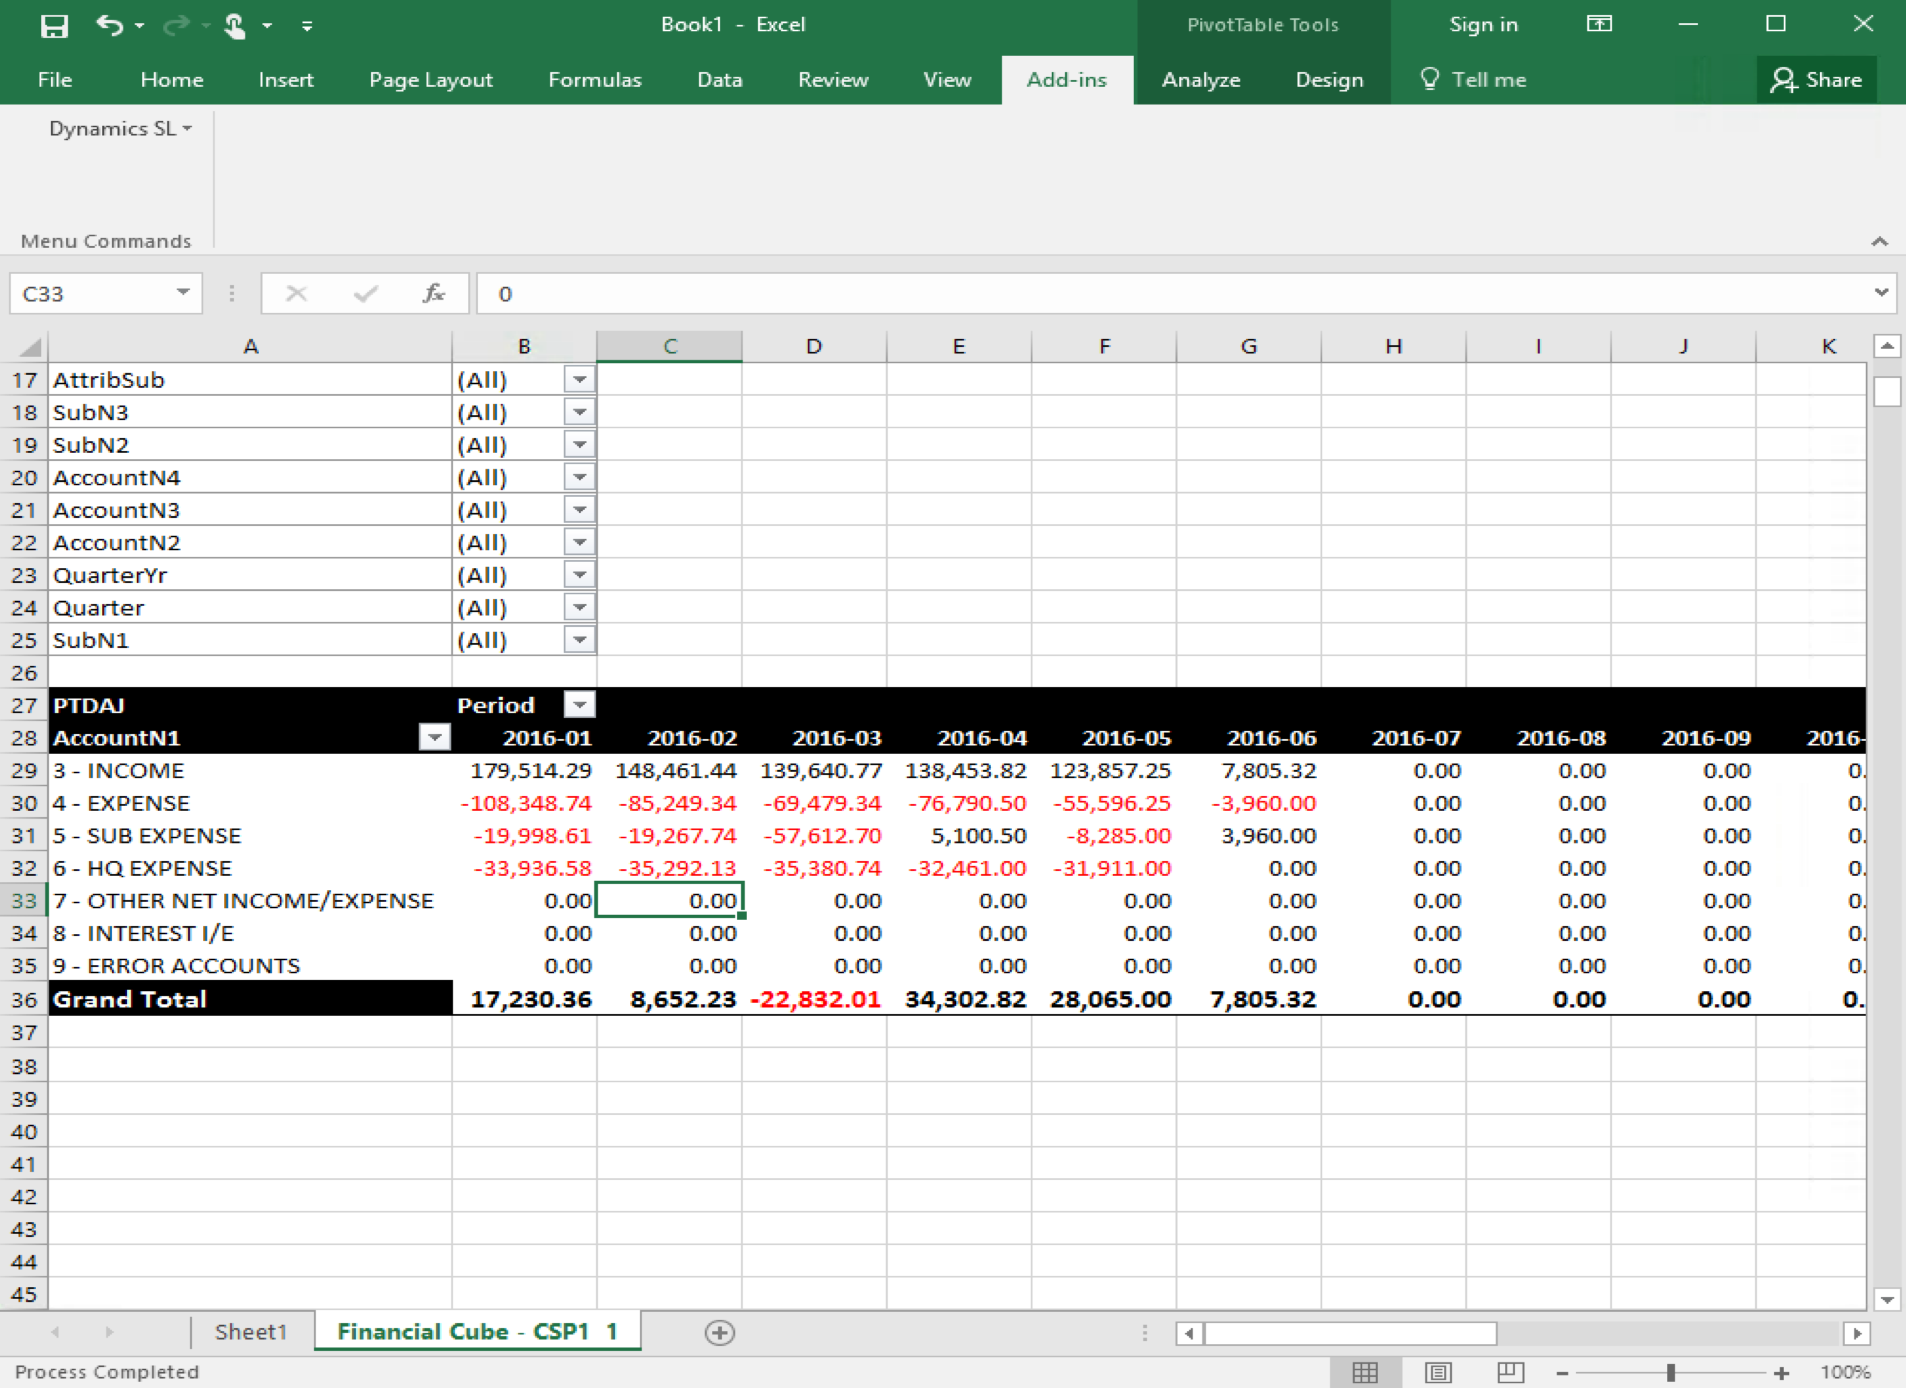
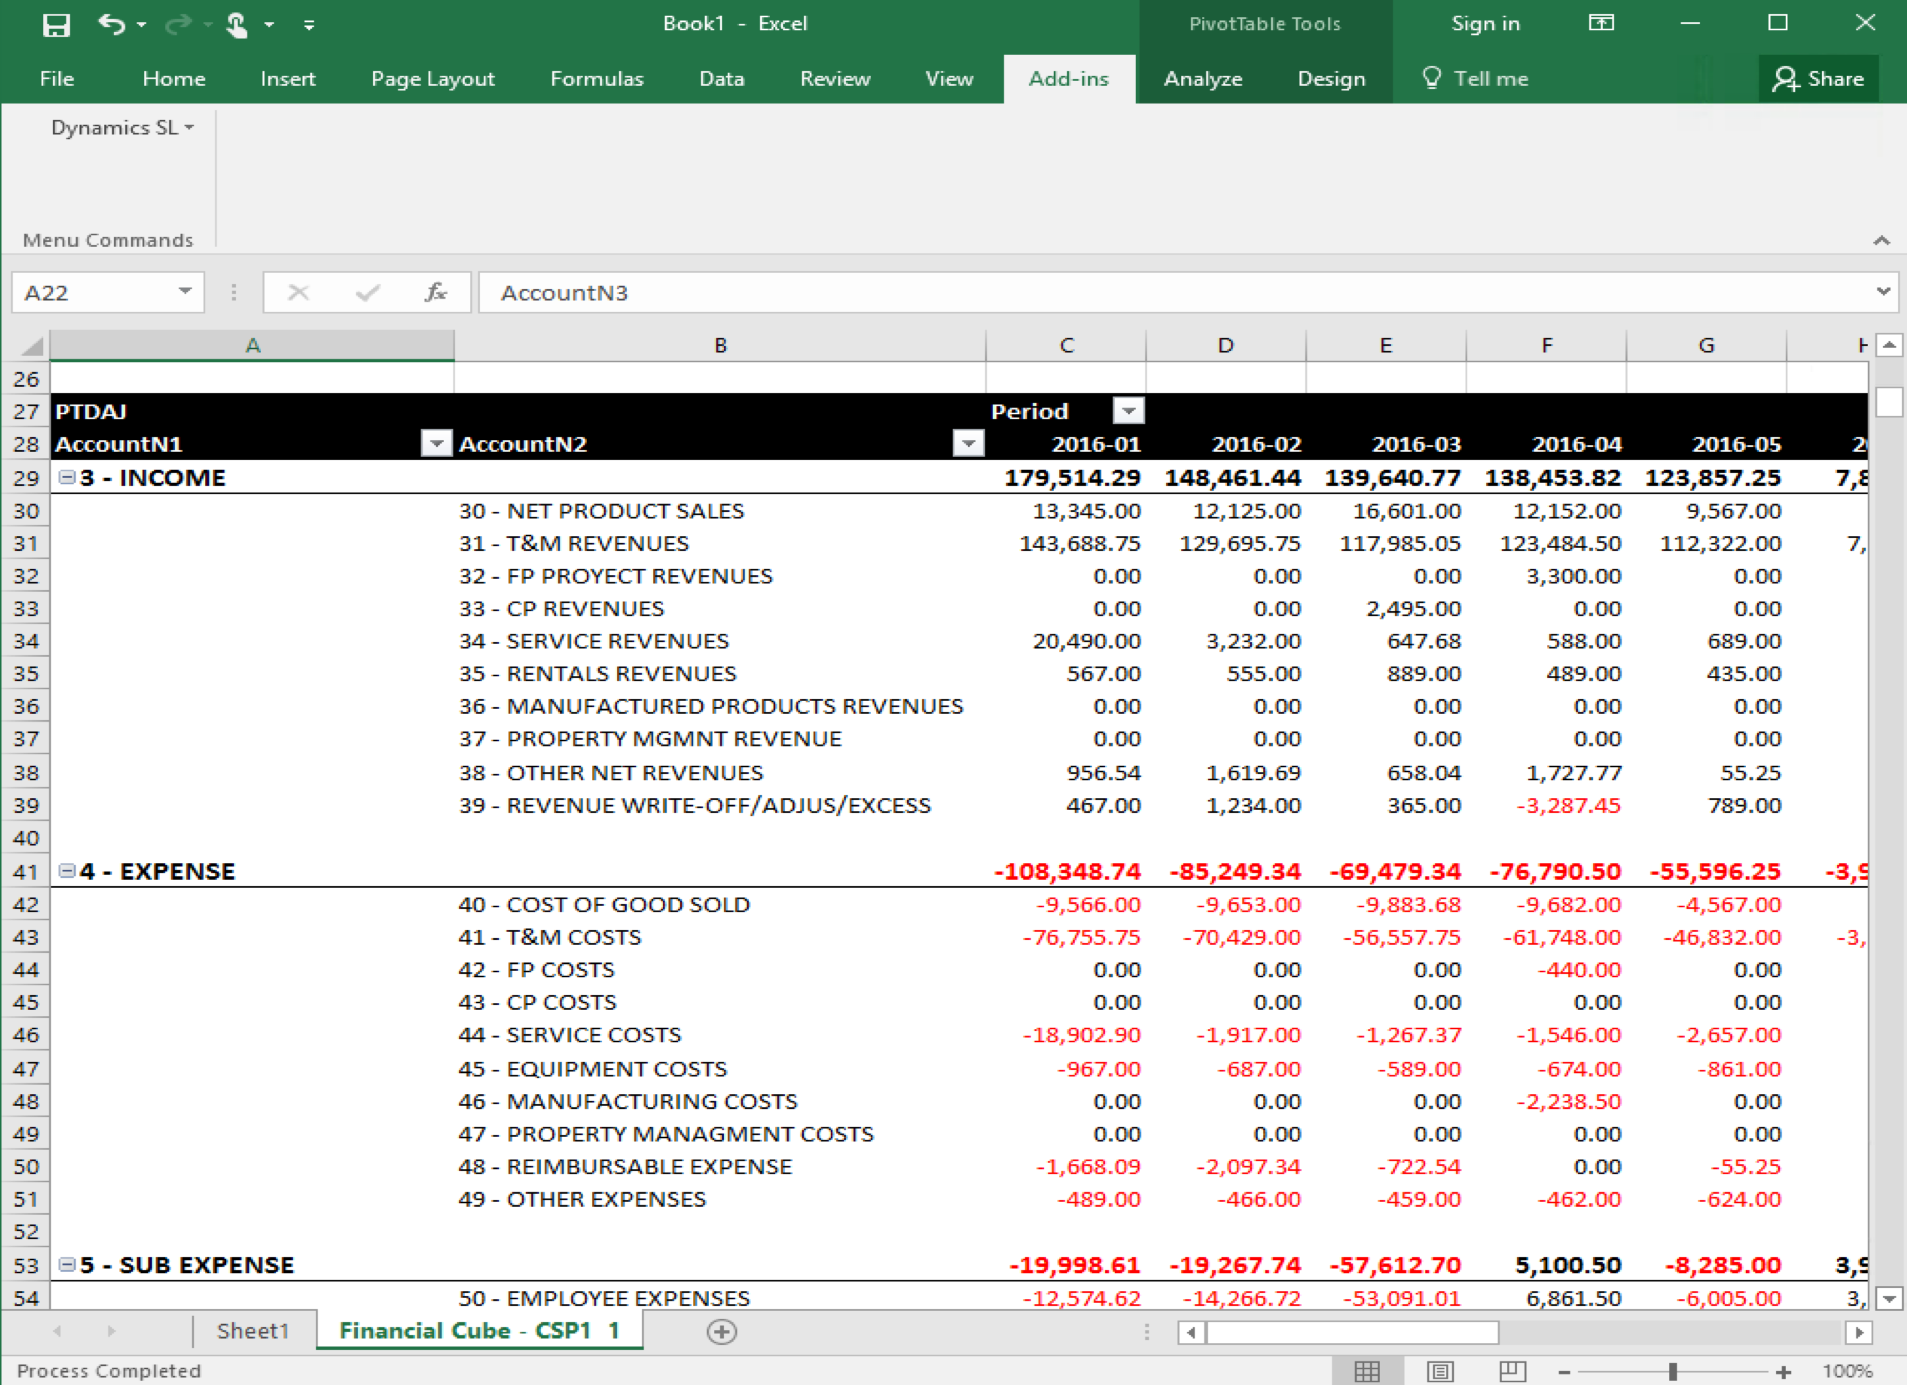
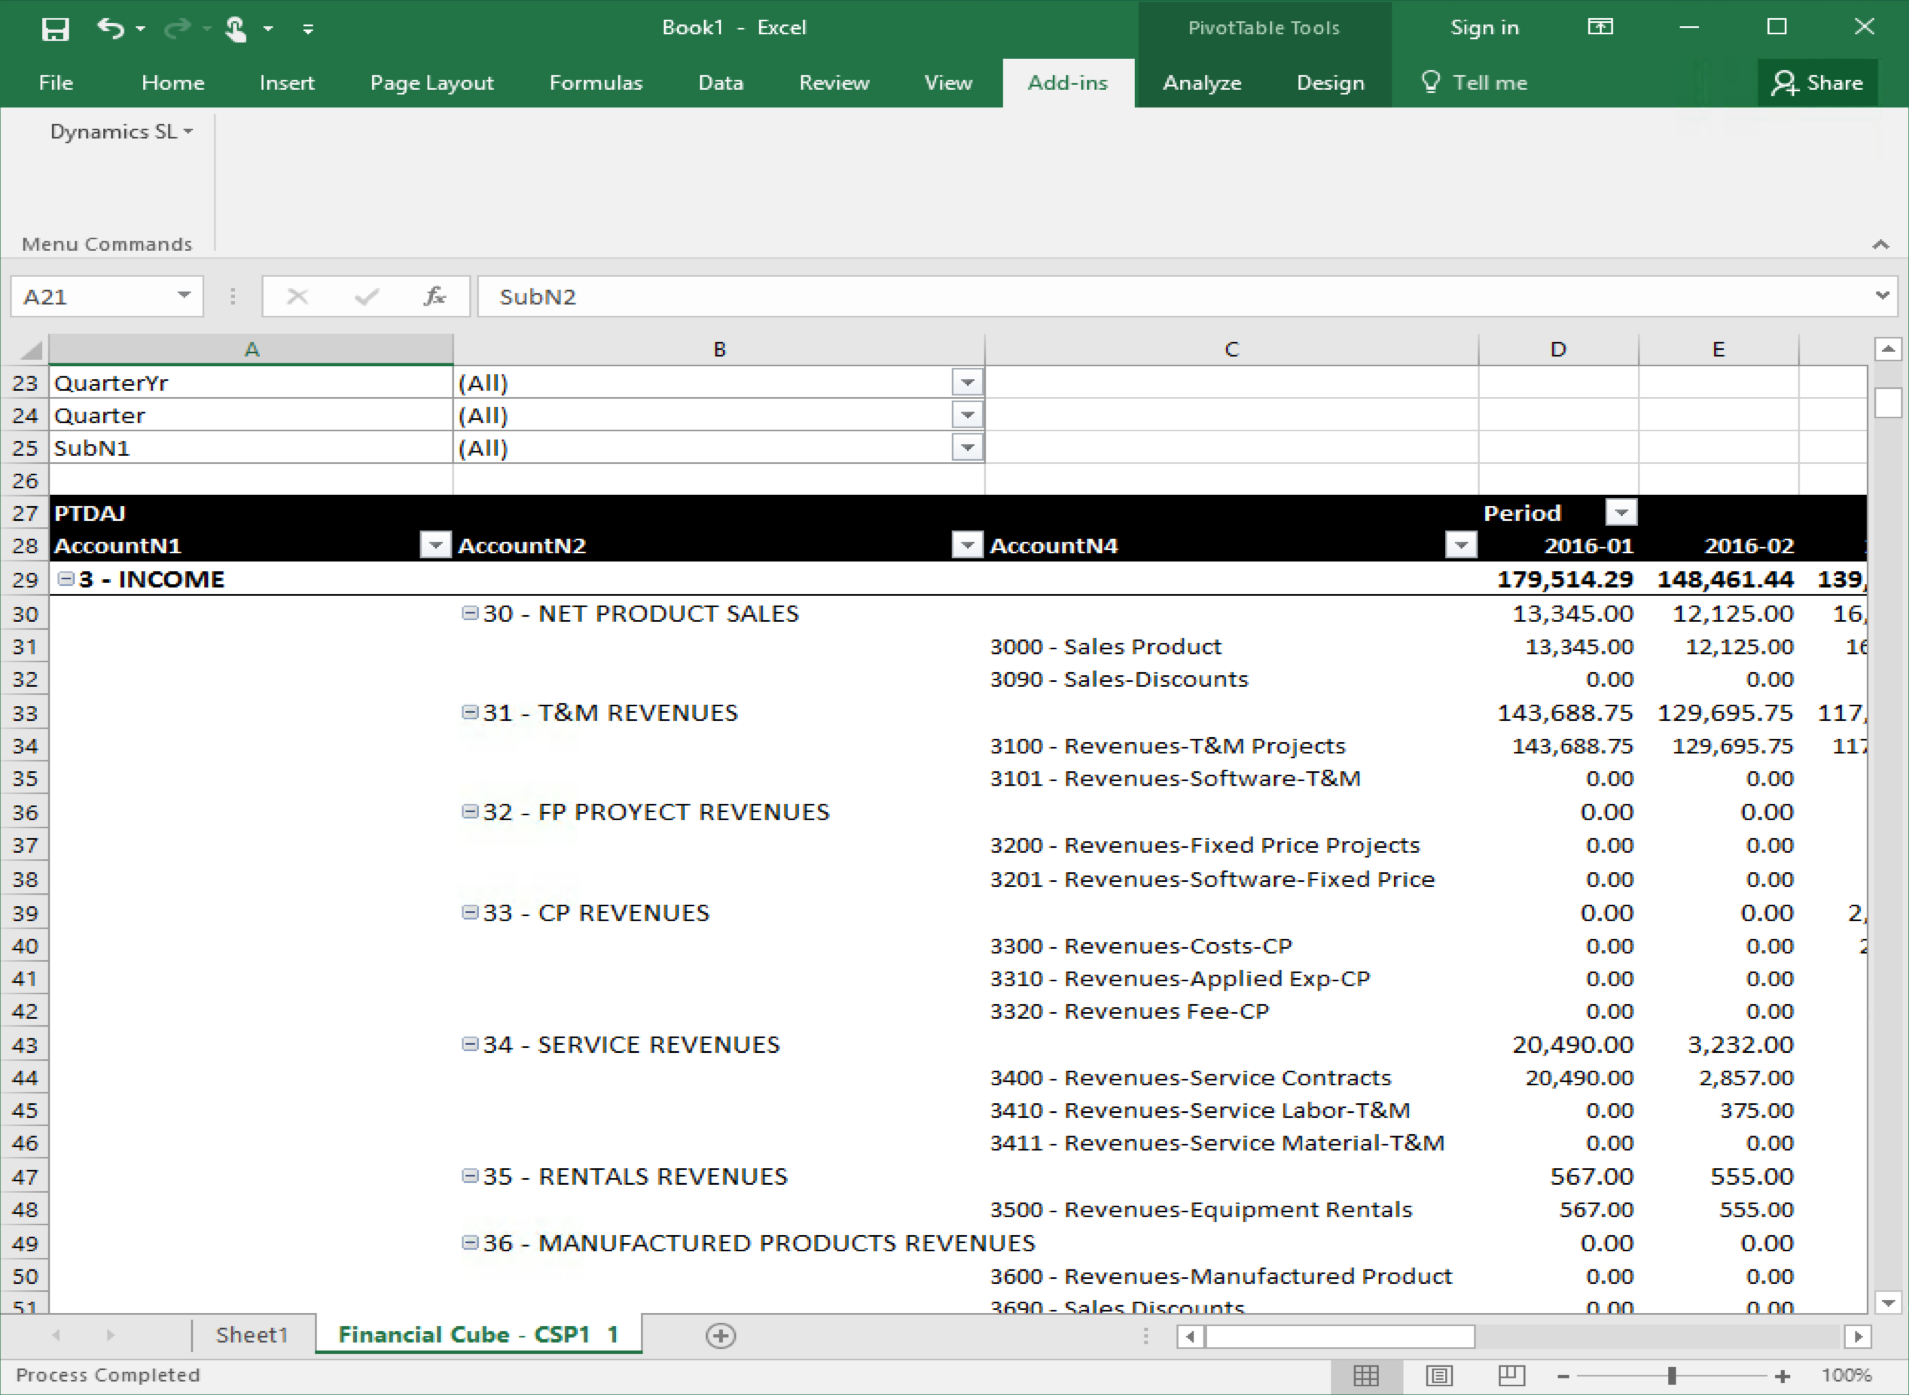
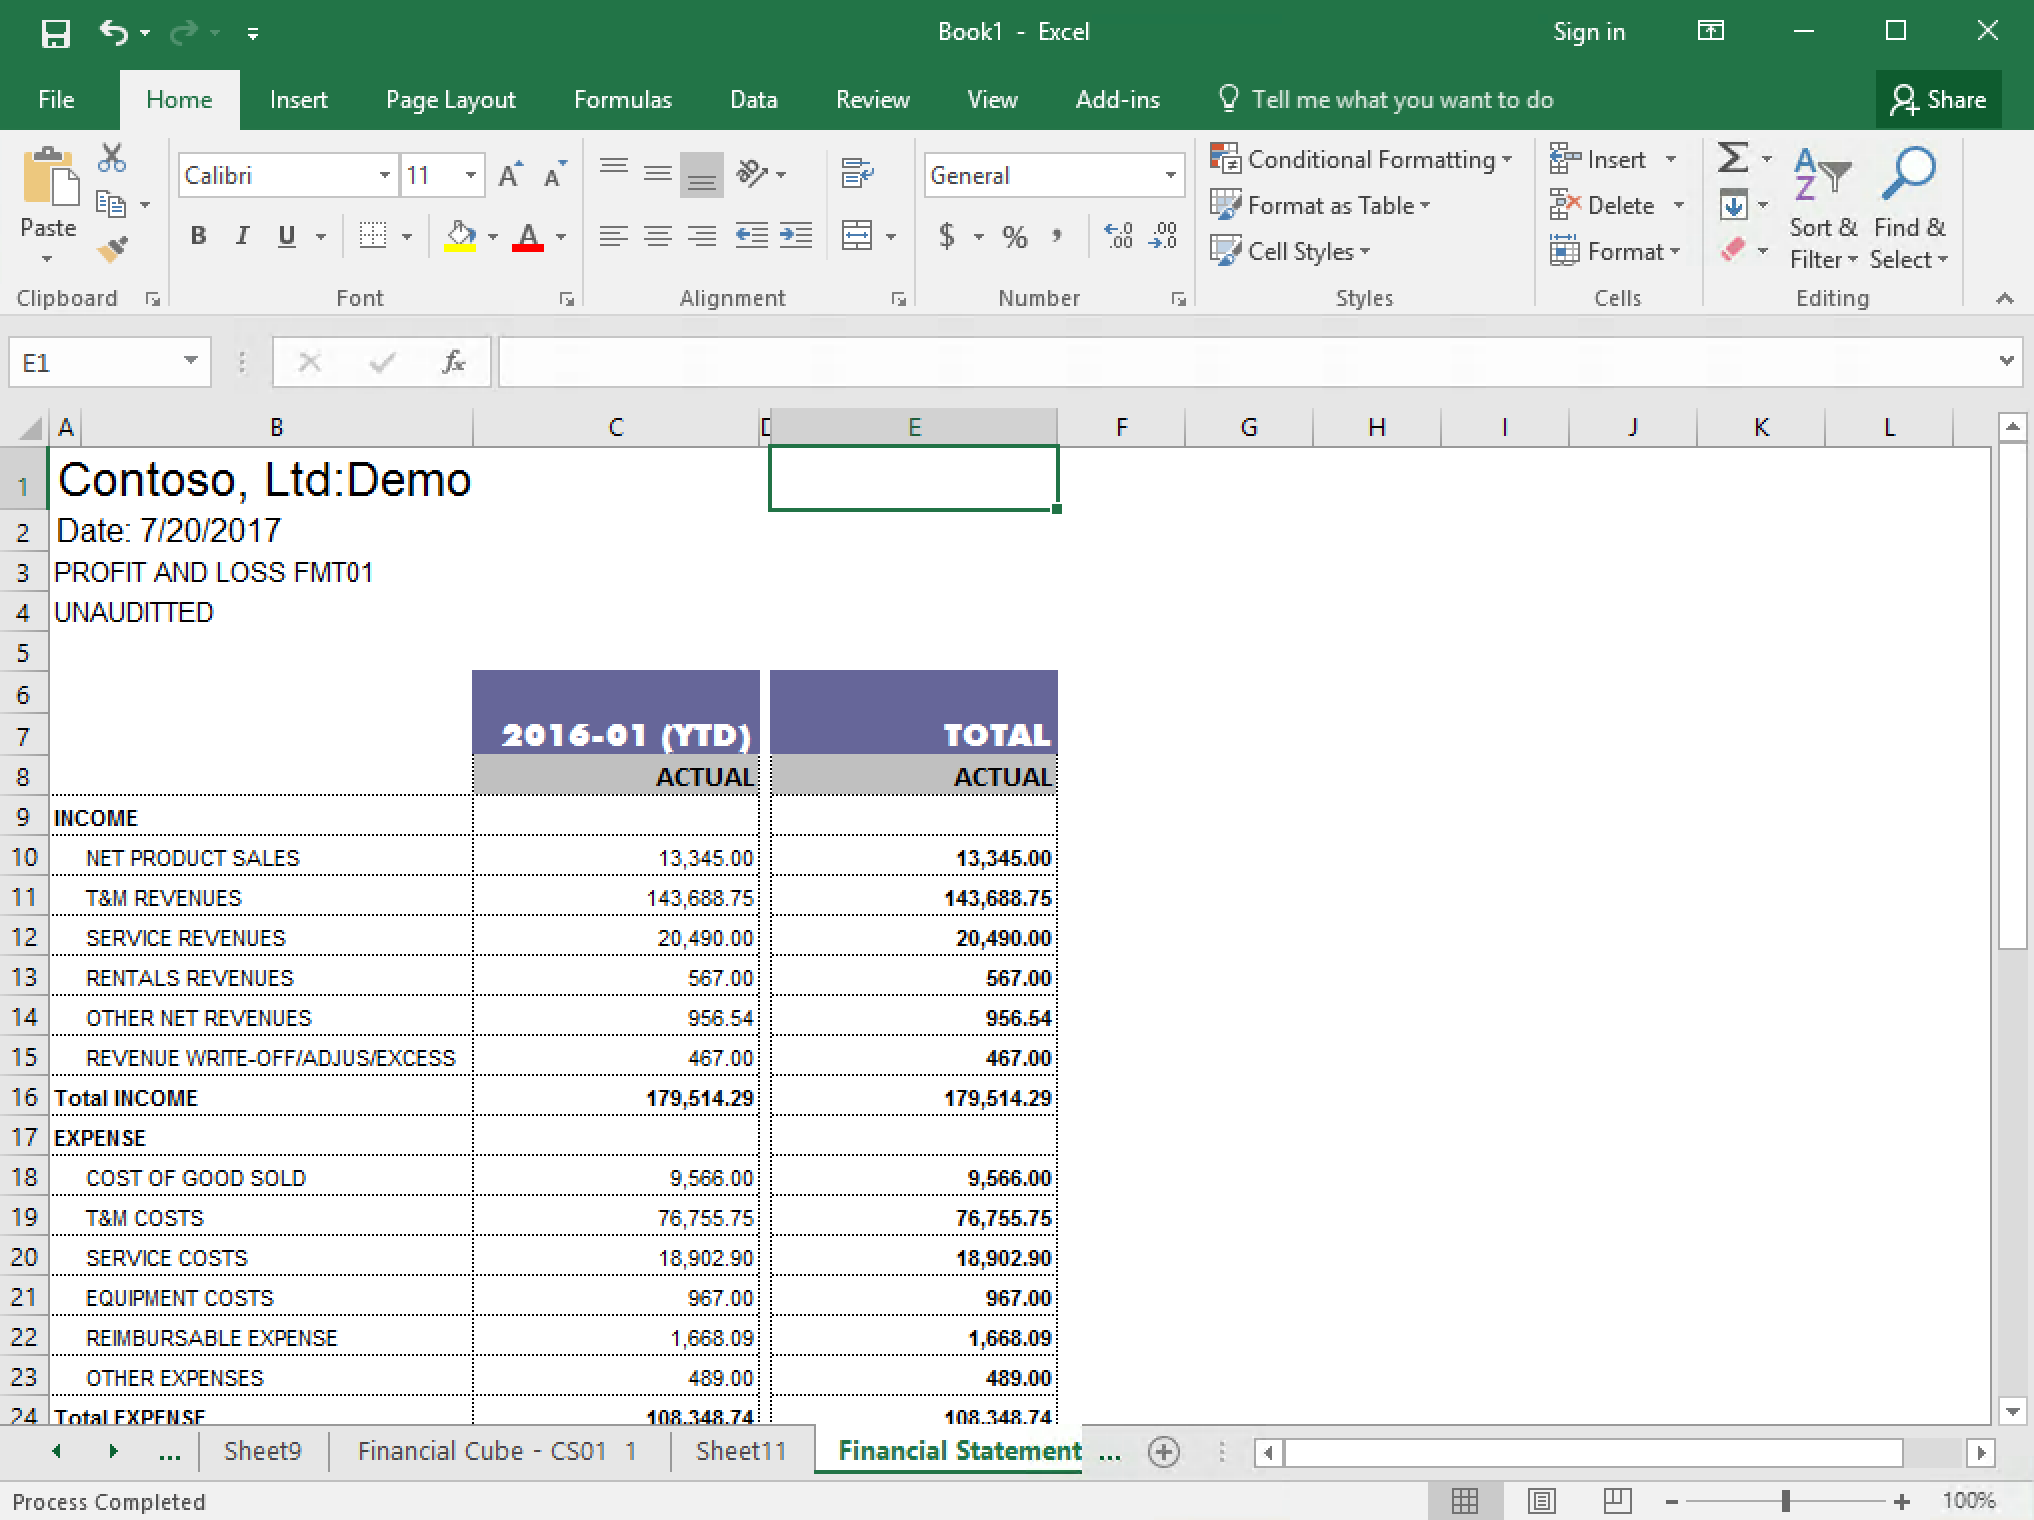
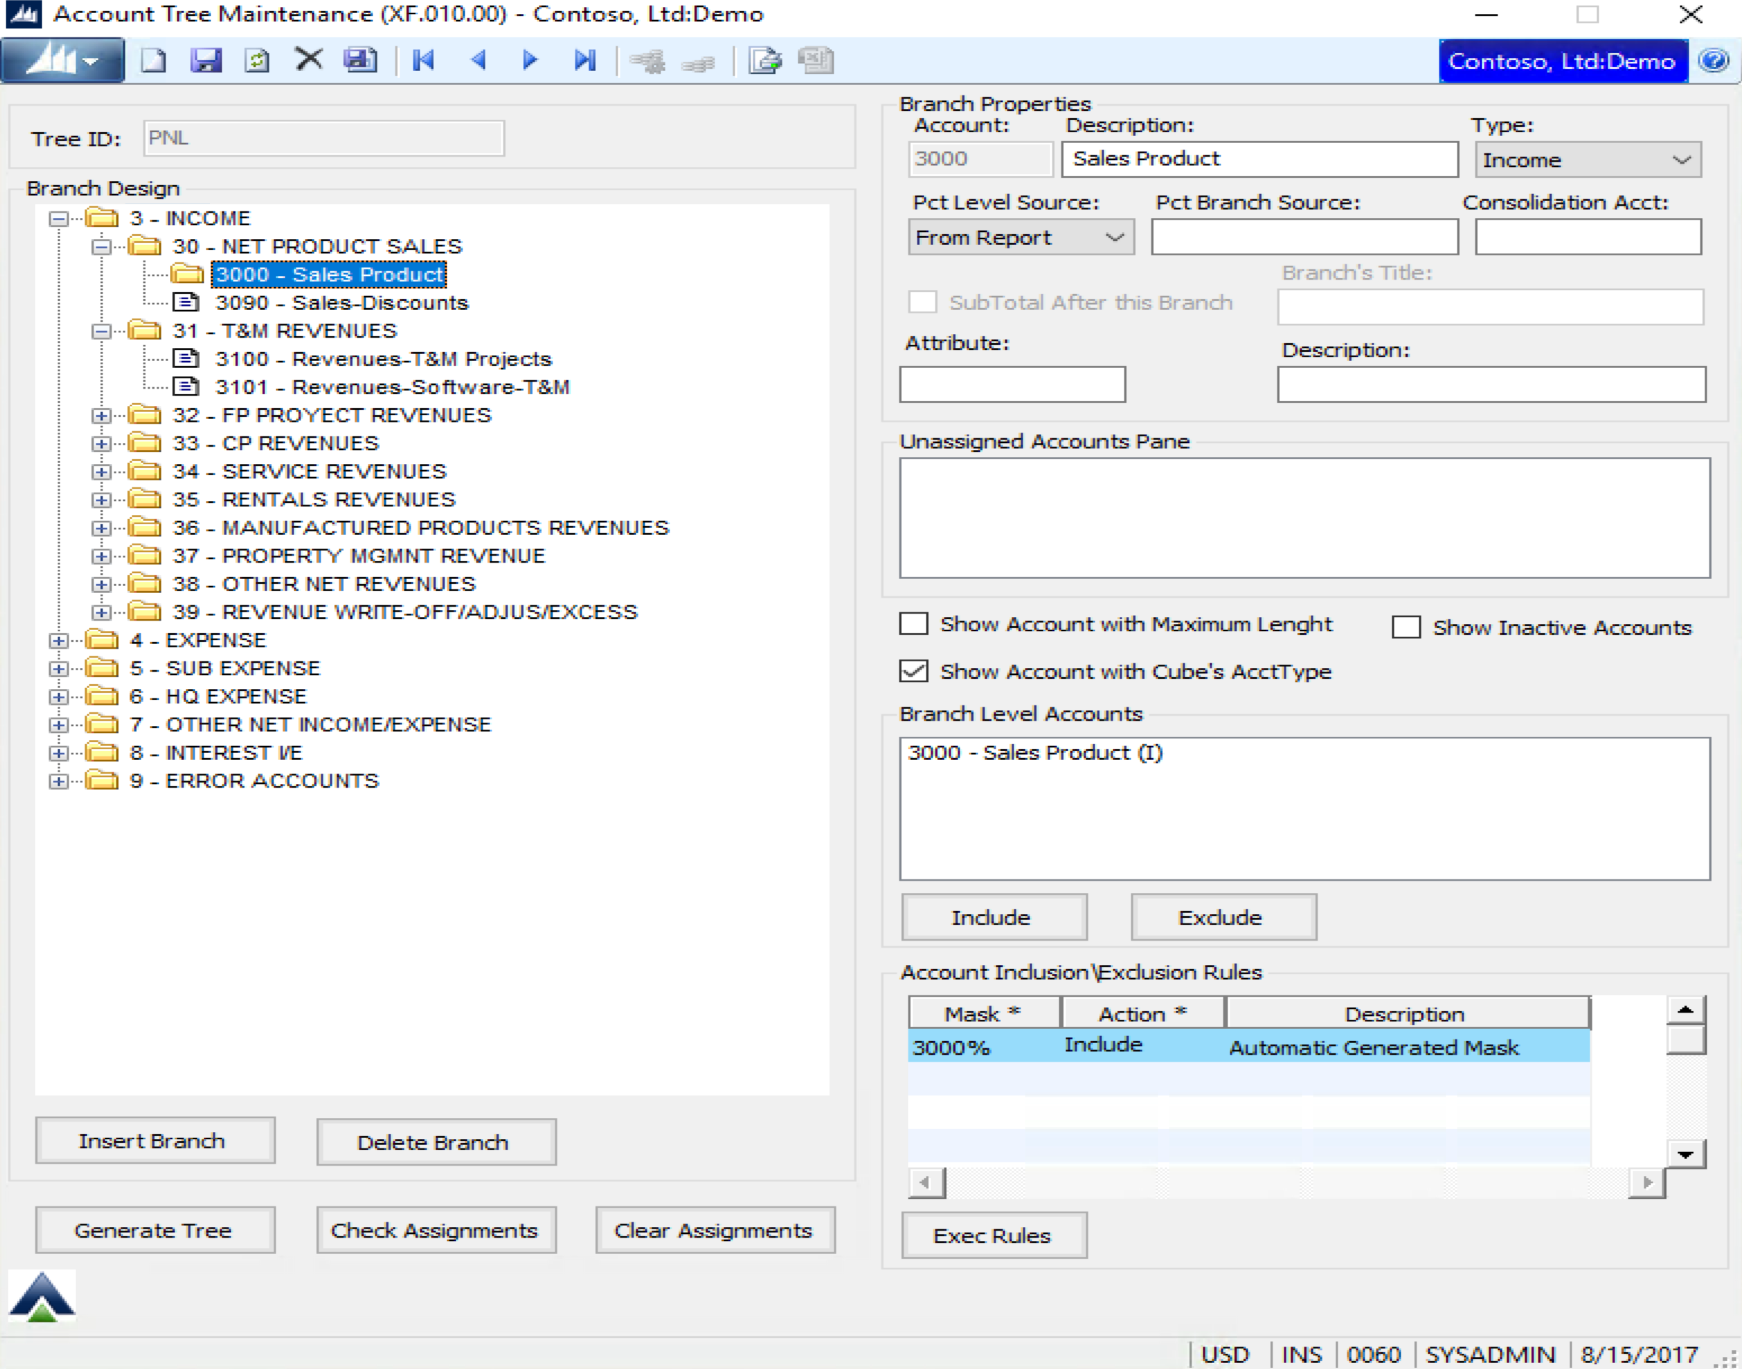
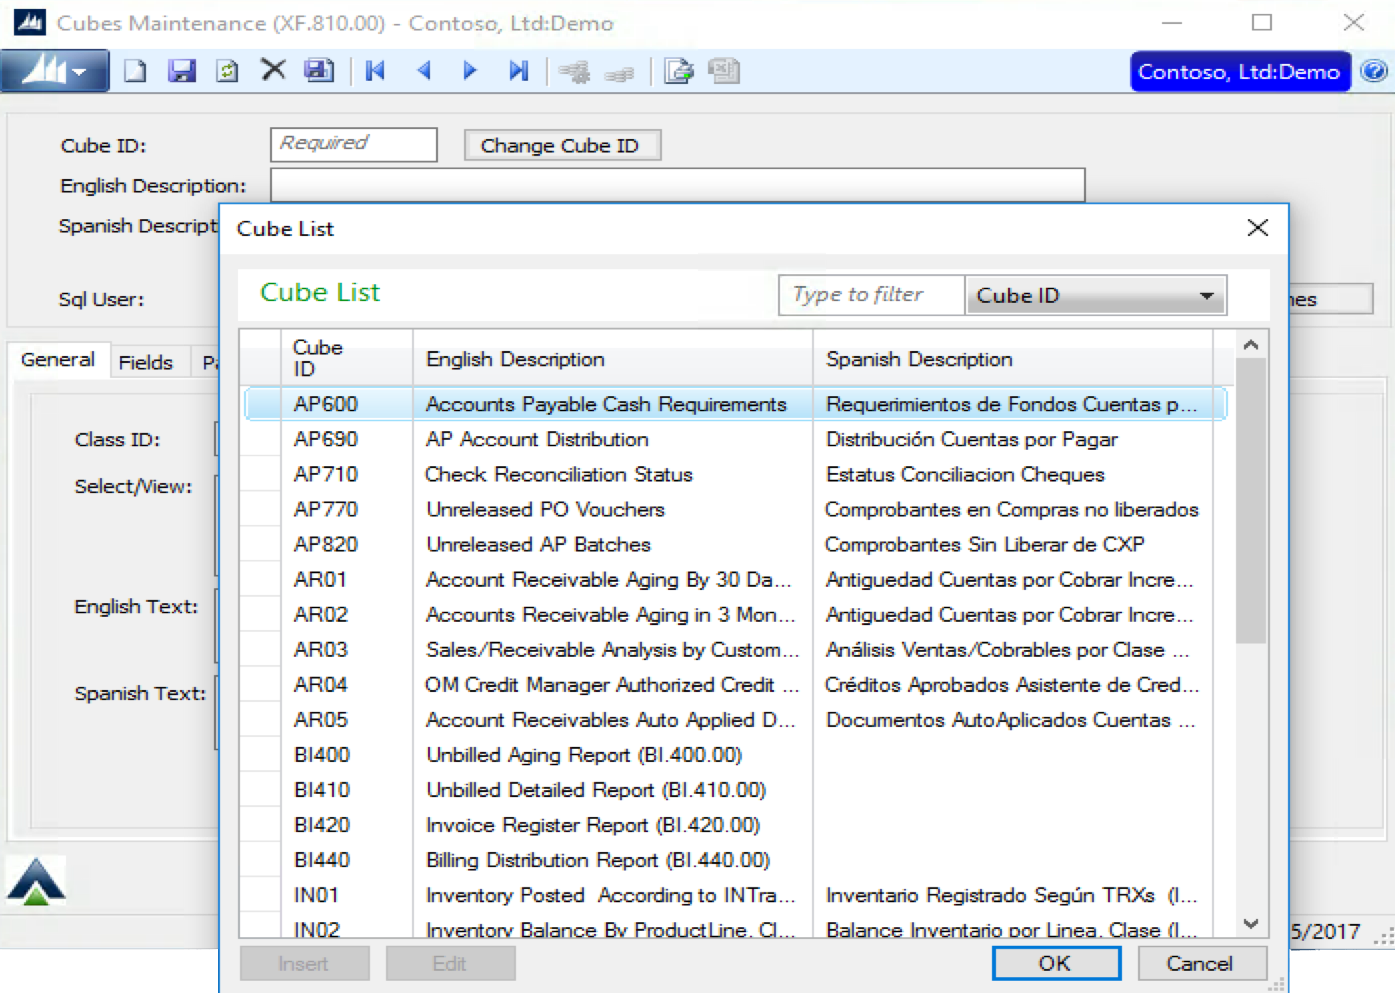
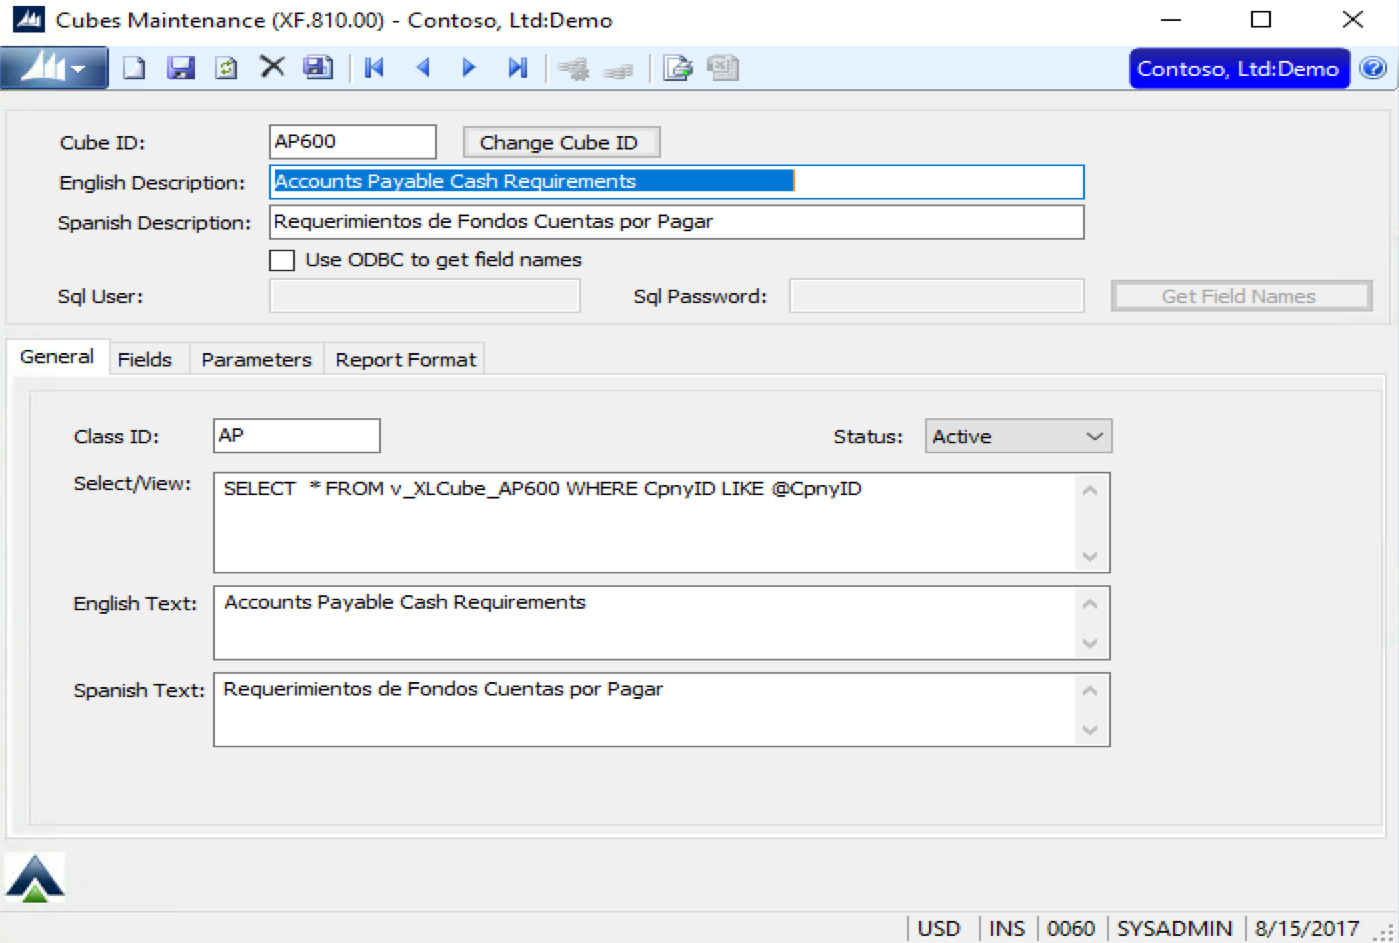
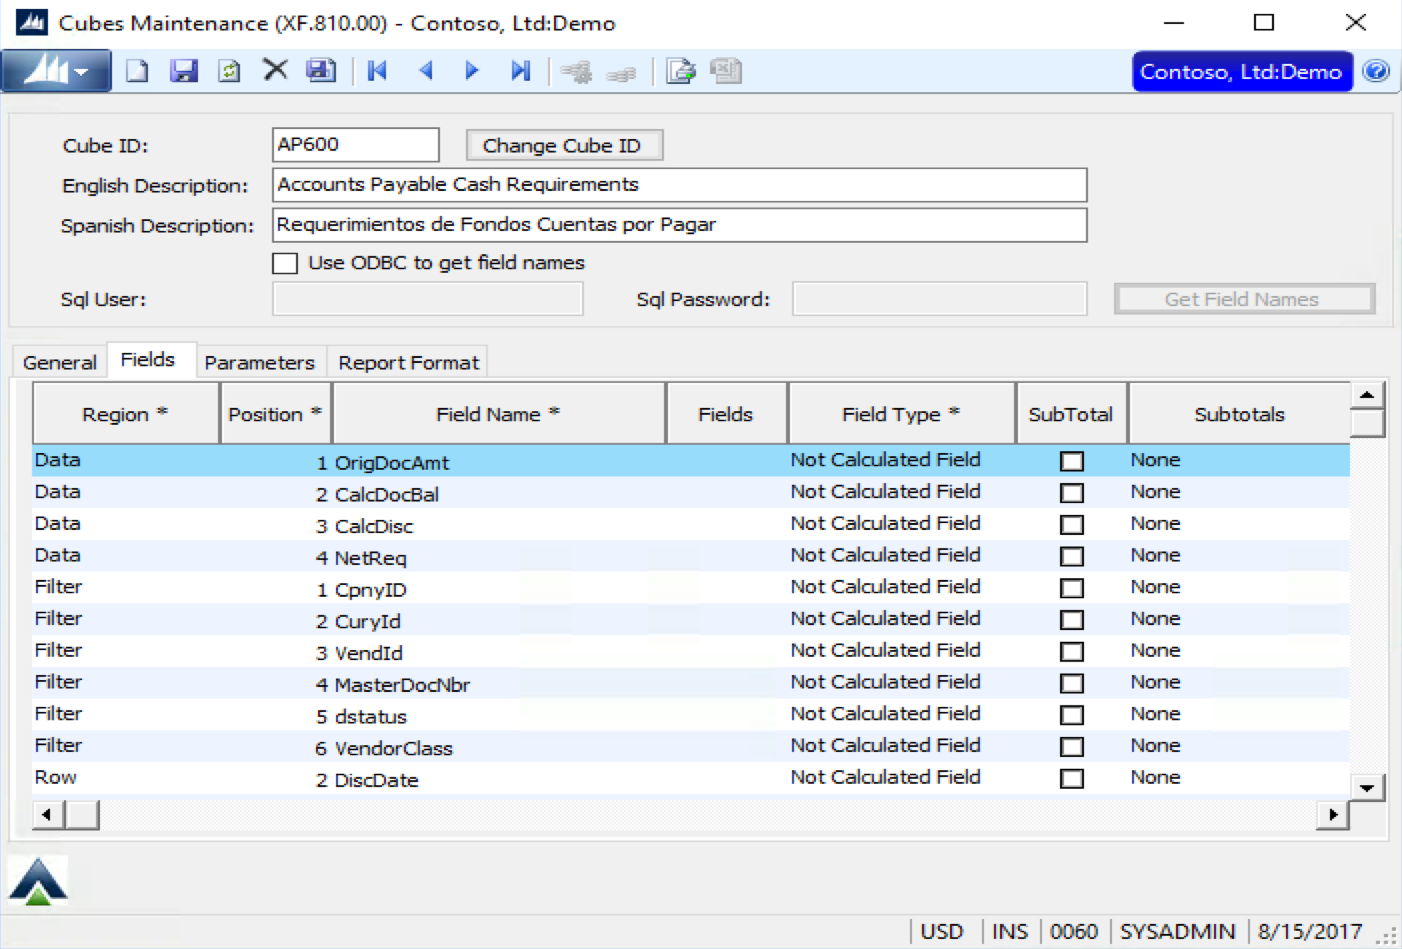
Financial Cubes
This feature provides enormous flexibility for financial reports and analysis. It will create a Pivot table with a Financial statement. Many dimensions are available to play with, department (Segments of sub-account), periods, years, ledgers, etc., so users can play around with dimensions and build different views, with different aggregation levels of financial statements. These cubes utilize the“Trees” or hierarchy that XL Analyzer add to Accounts and Sub-Accounts in Dynamics SL, allowing levels of aggregation on Accounts and Sub-Accounts. In the last 3 images, you can appreciate 3 different levels of aggregation for a Profit and Loose statement.
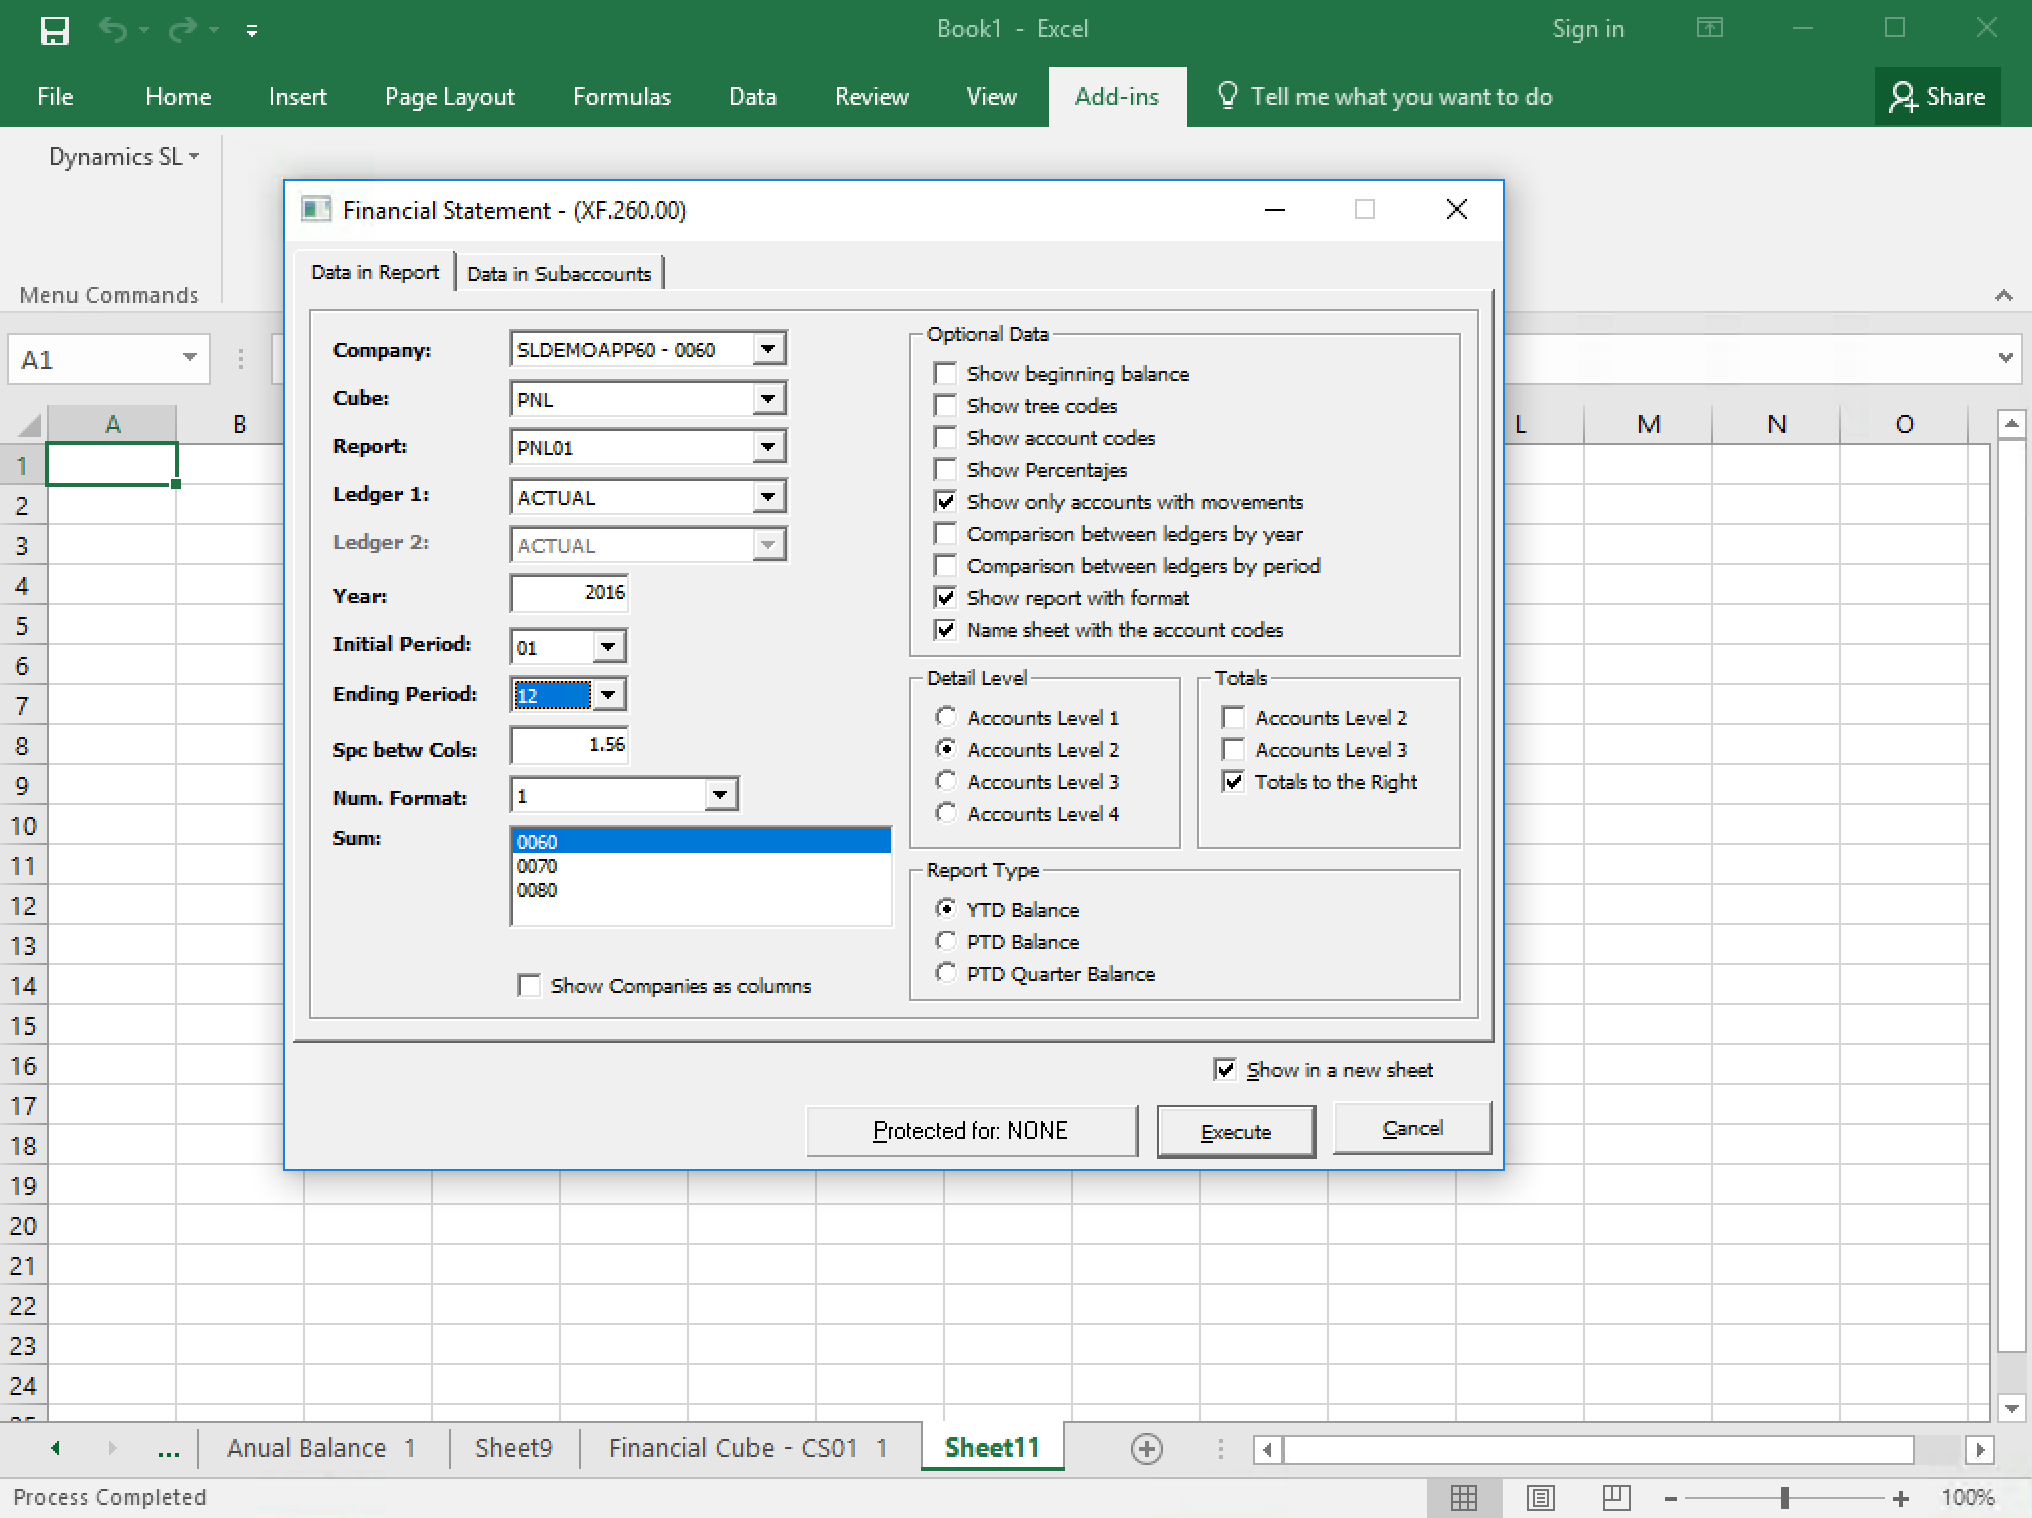
Financial Statements
This feature will build a financial statement in MS Excel, with formulas, based on the tree structures for Accounts and sub-accounts. The “Tree” structures is a hierarchy that XL Analyzer add to Accounts and Sub-Accounts in Dynamics SL, allowing levels of aggregation.
Account Receivables and Payables Features
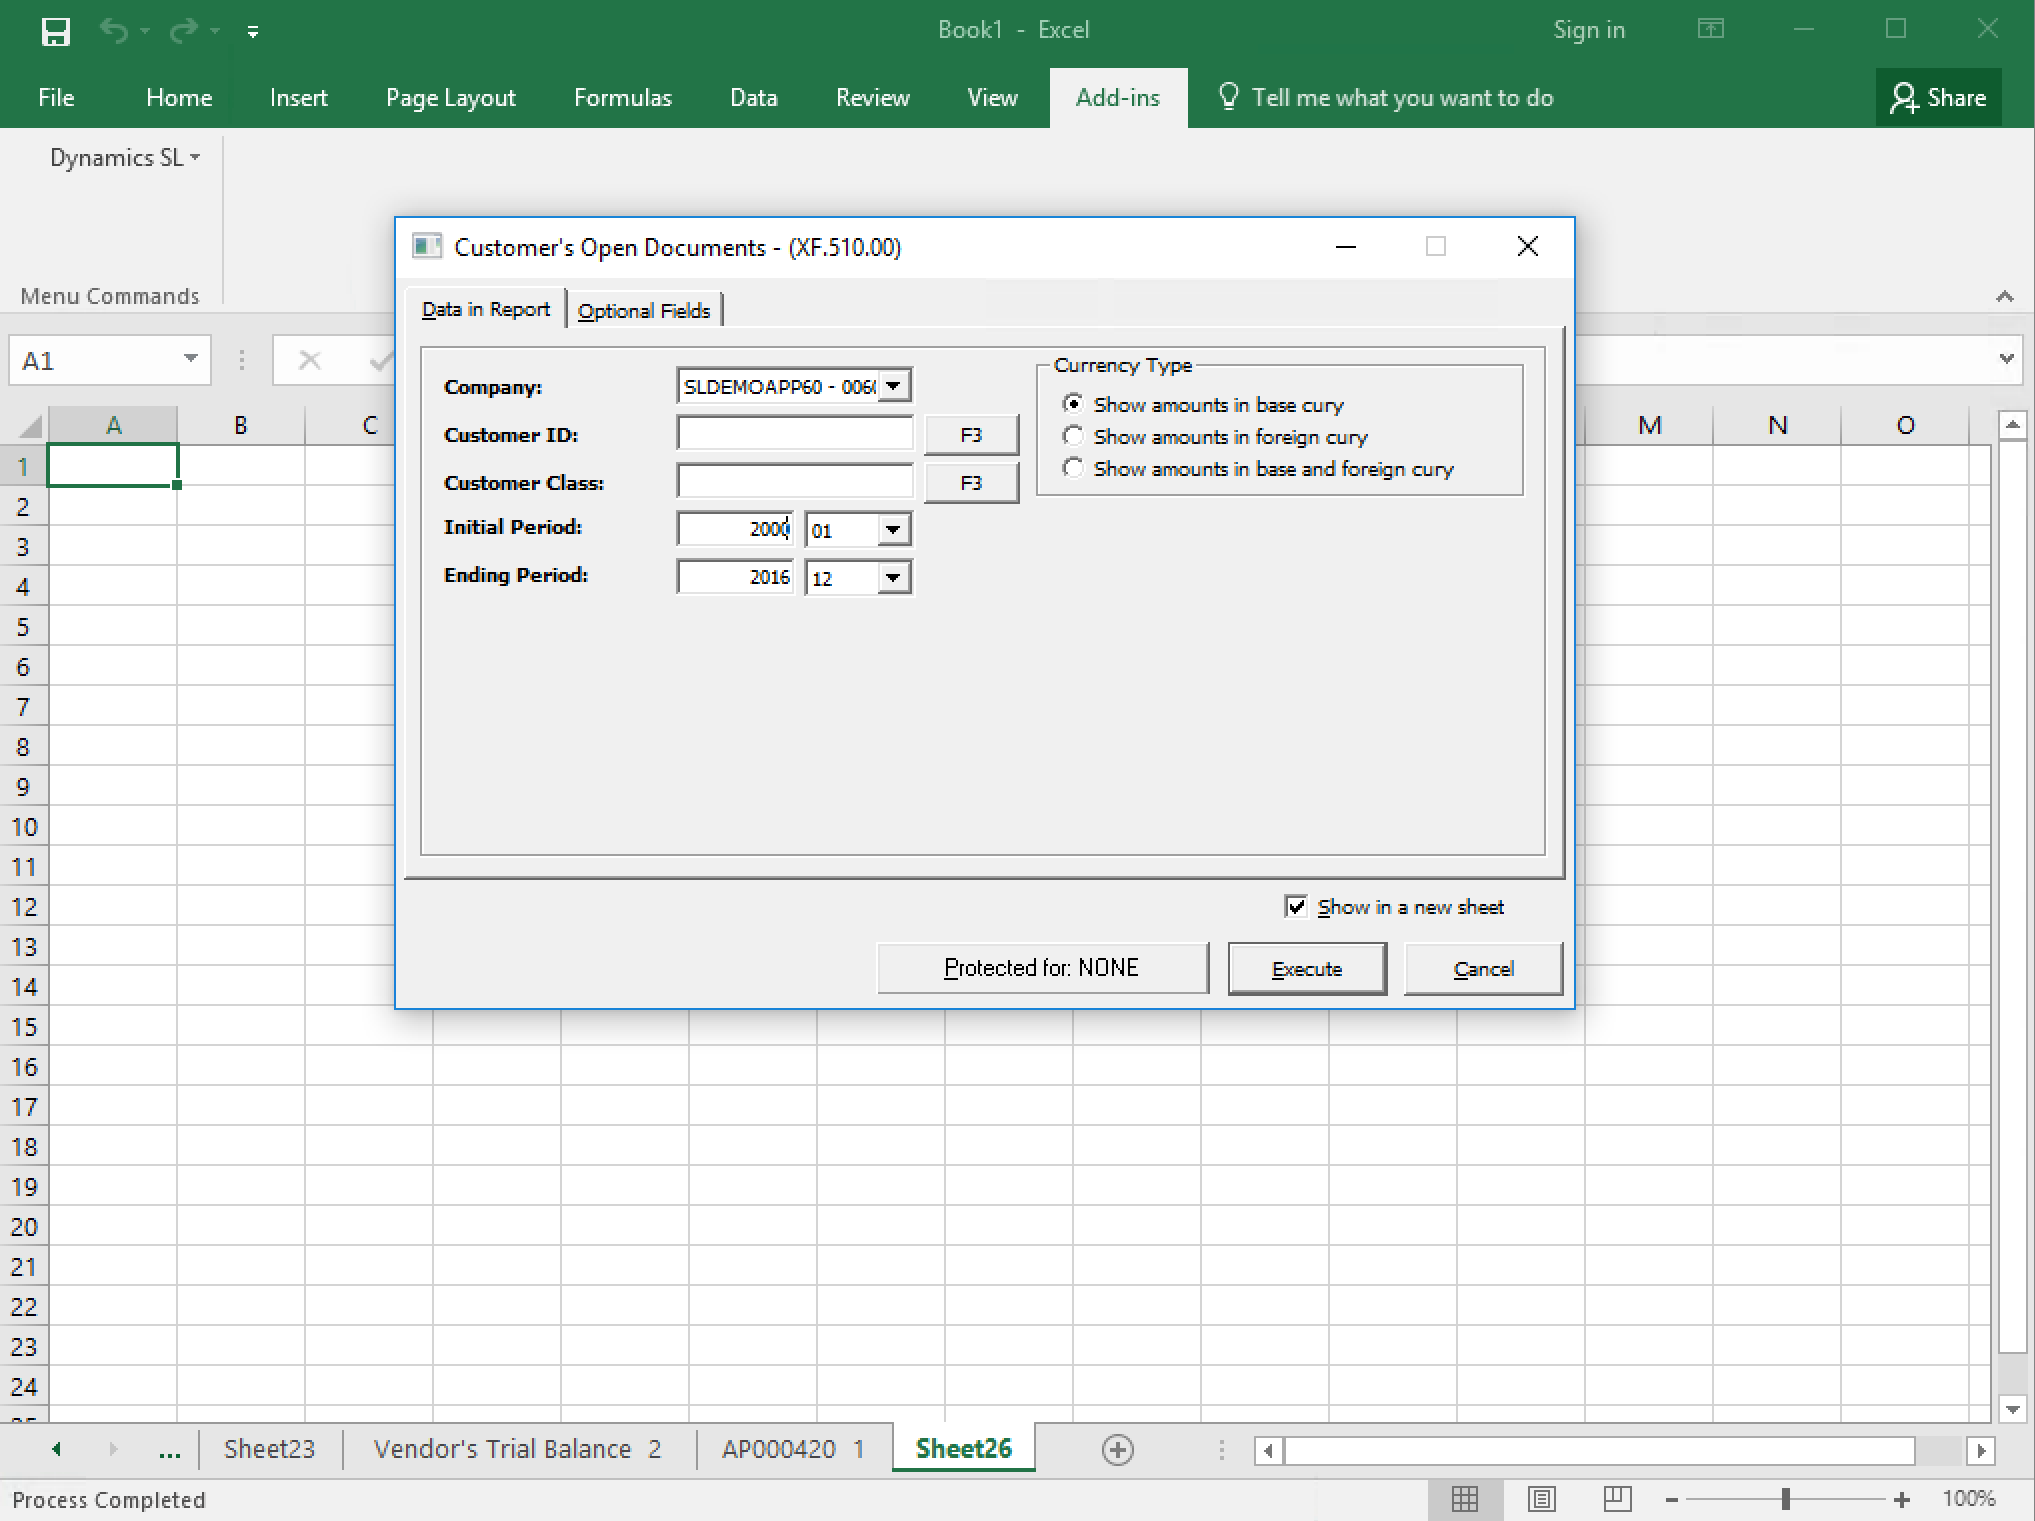
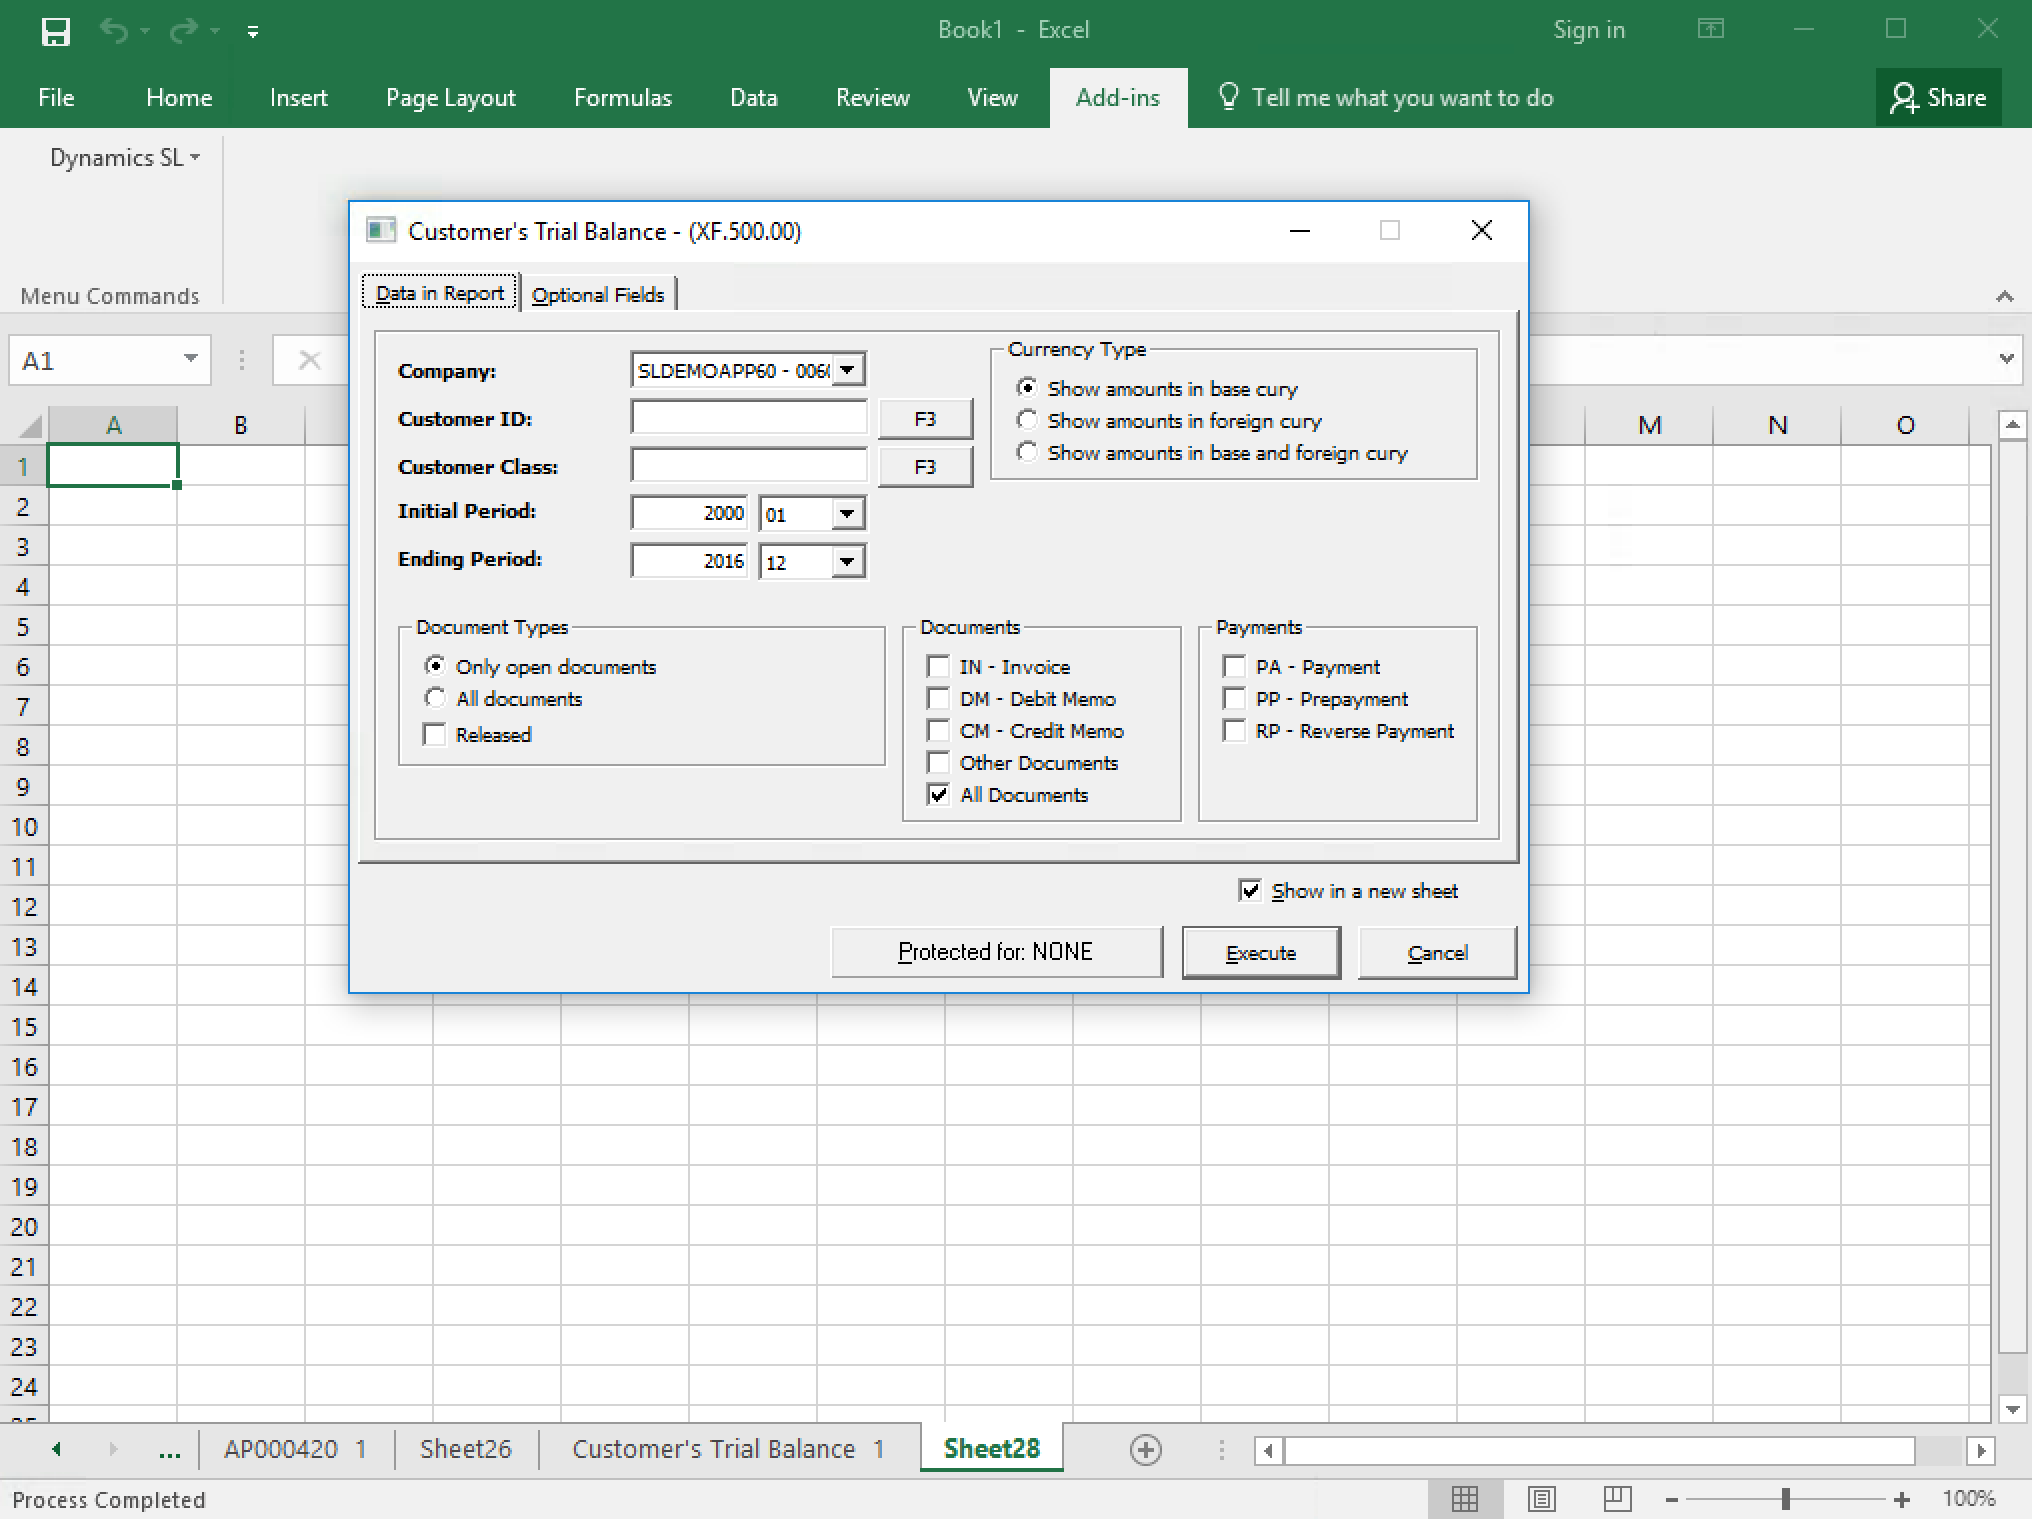
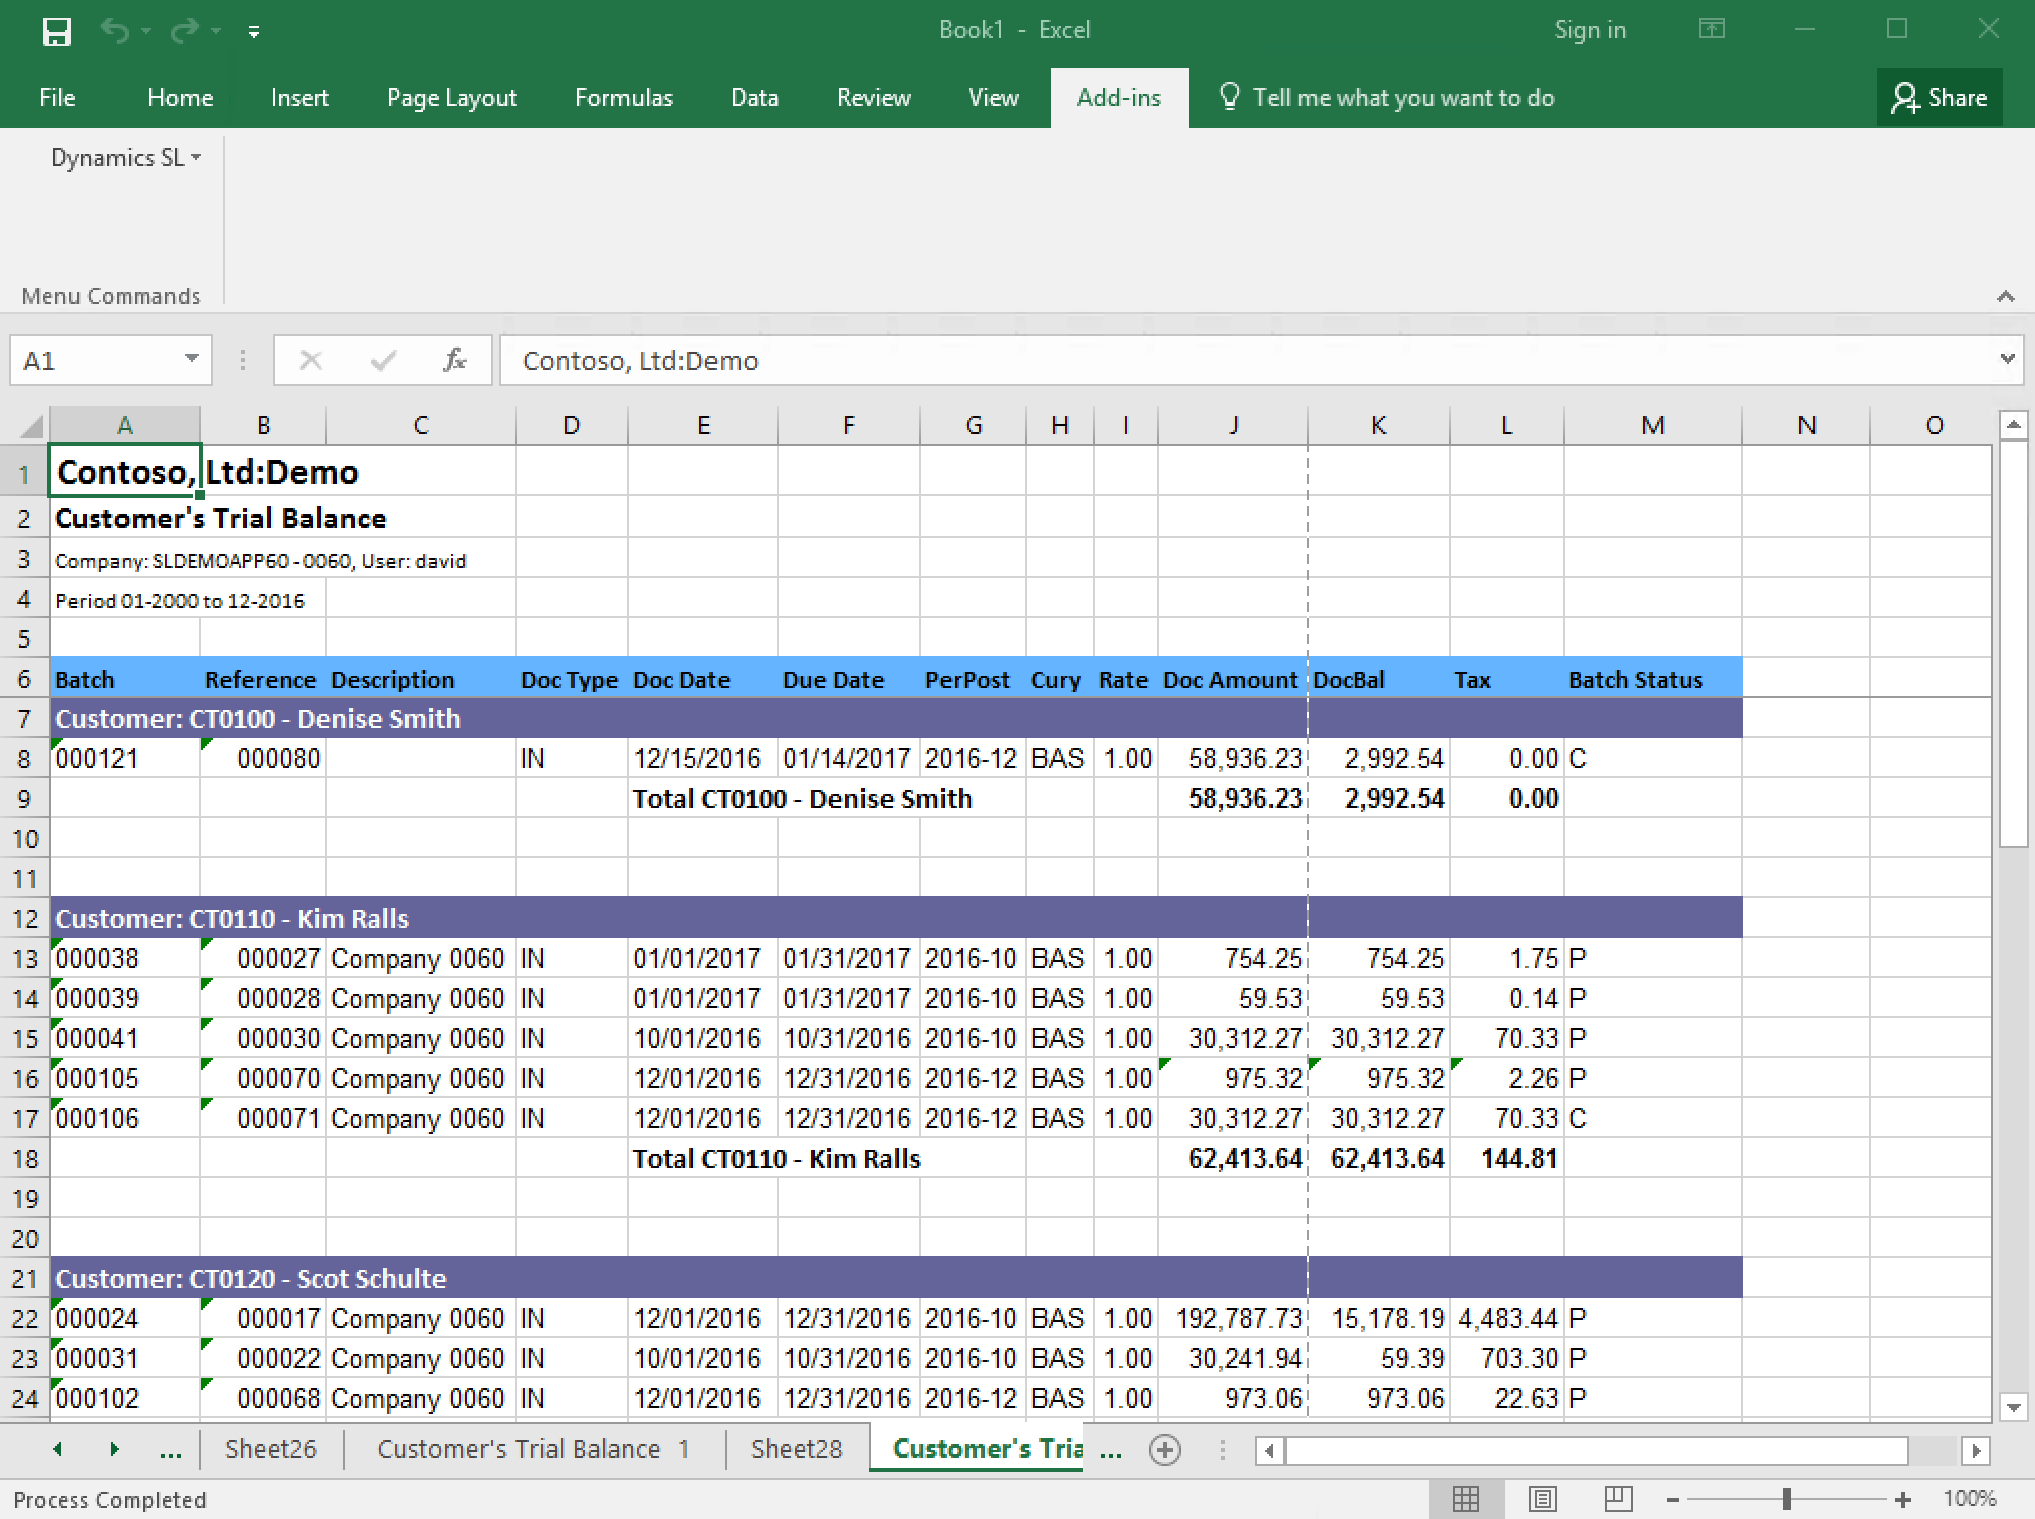
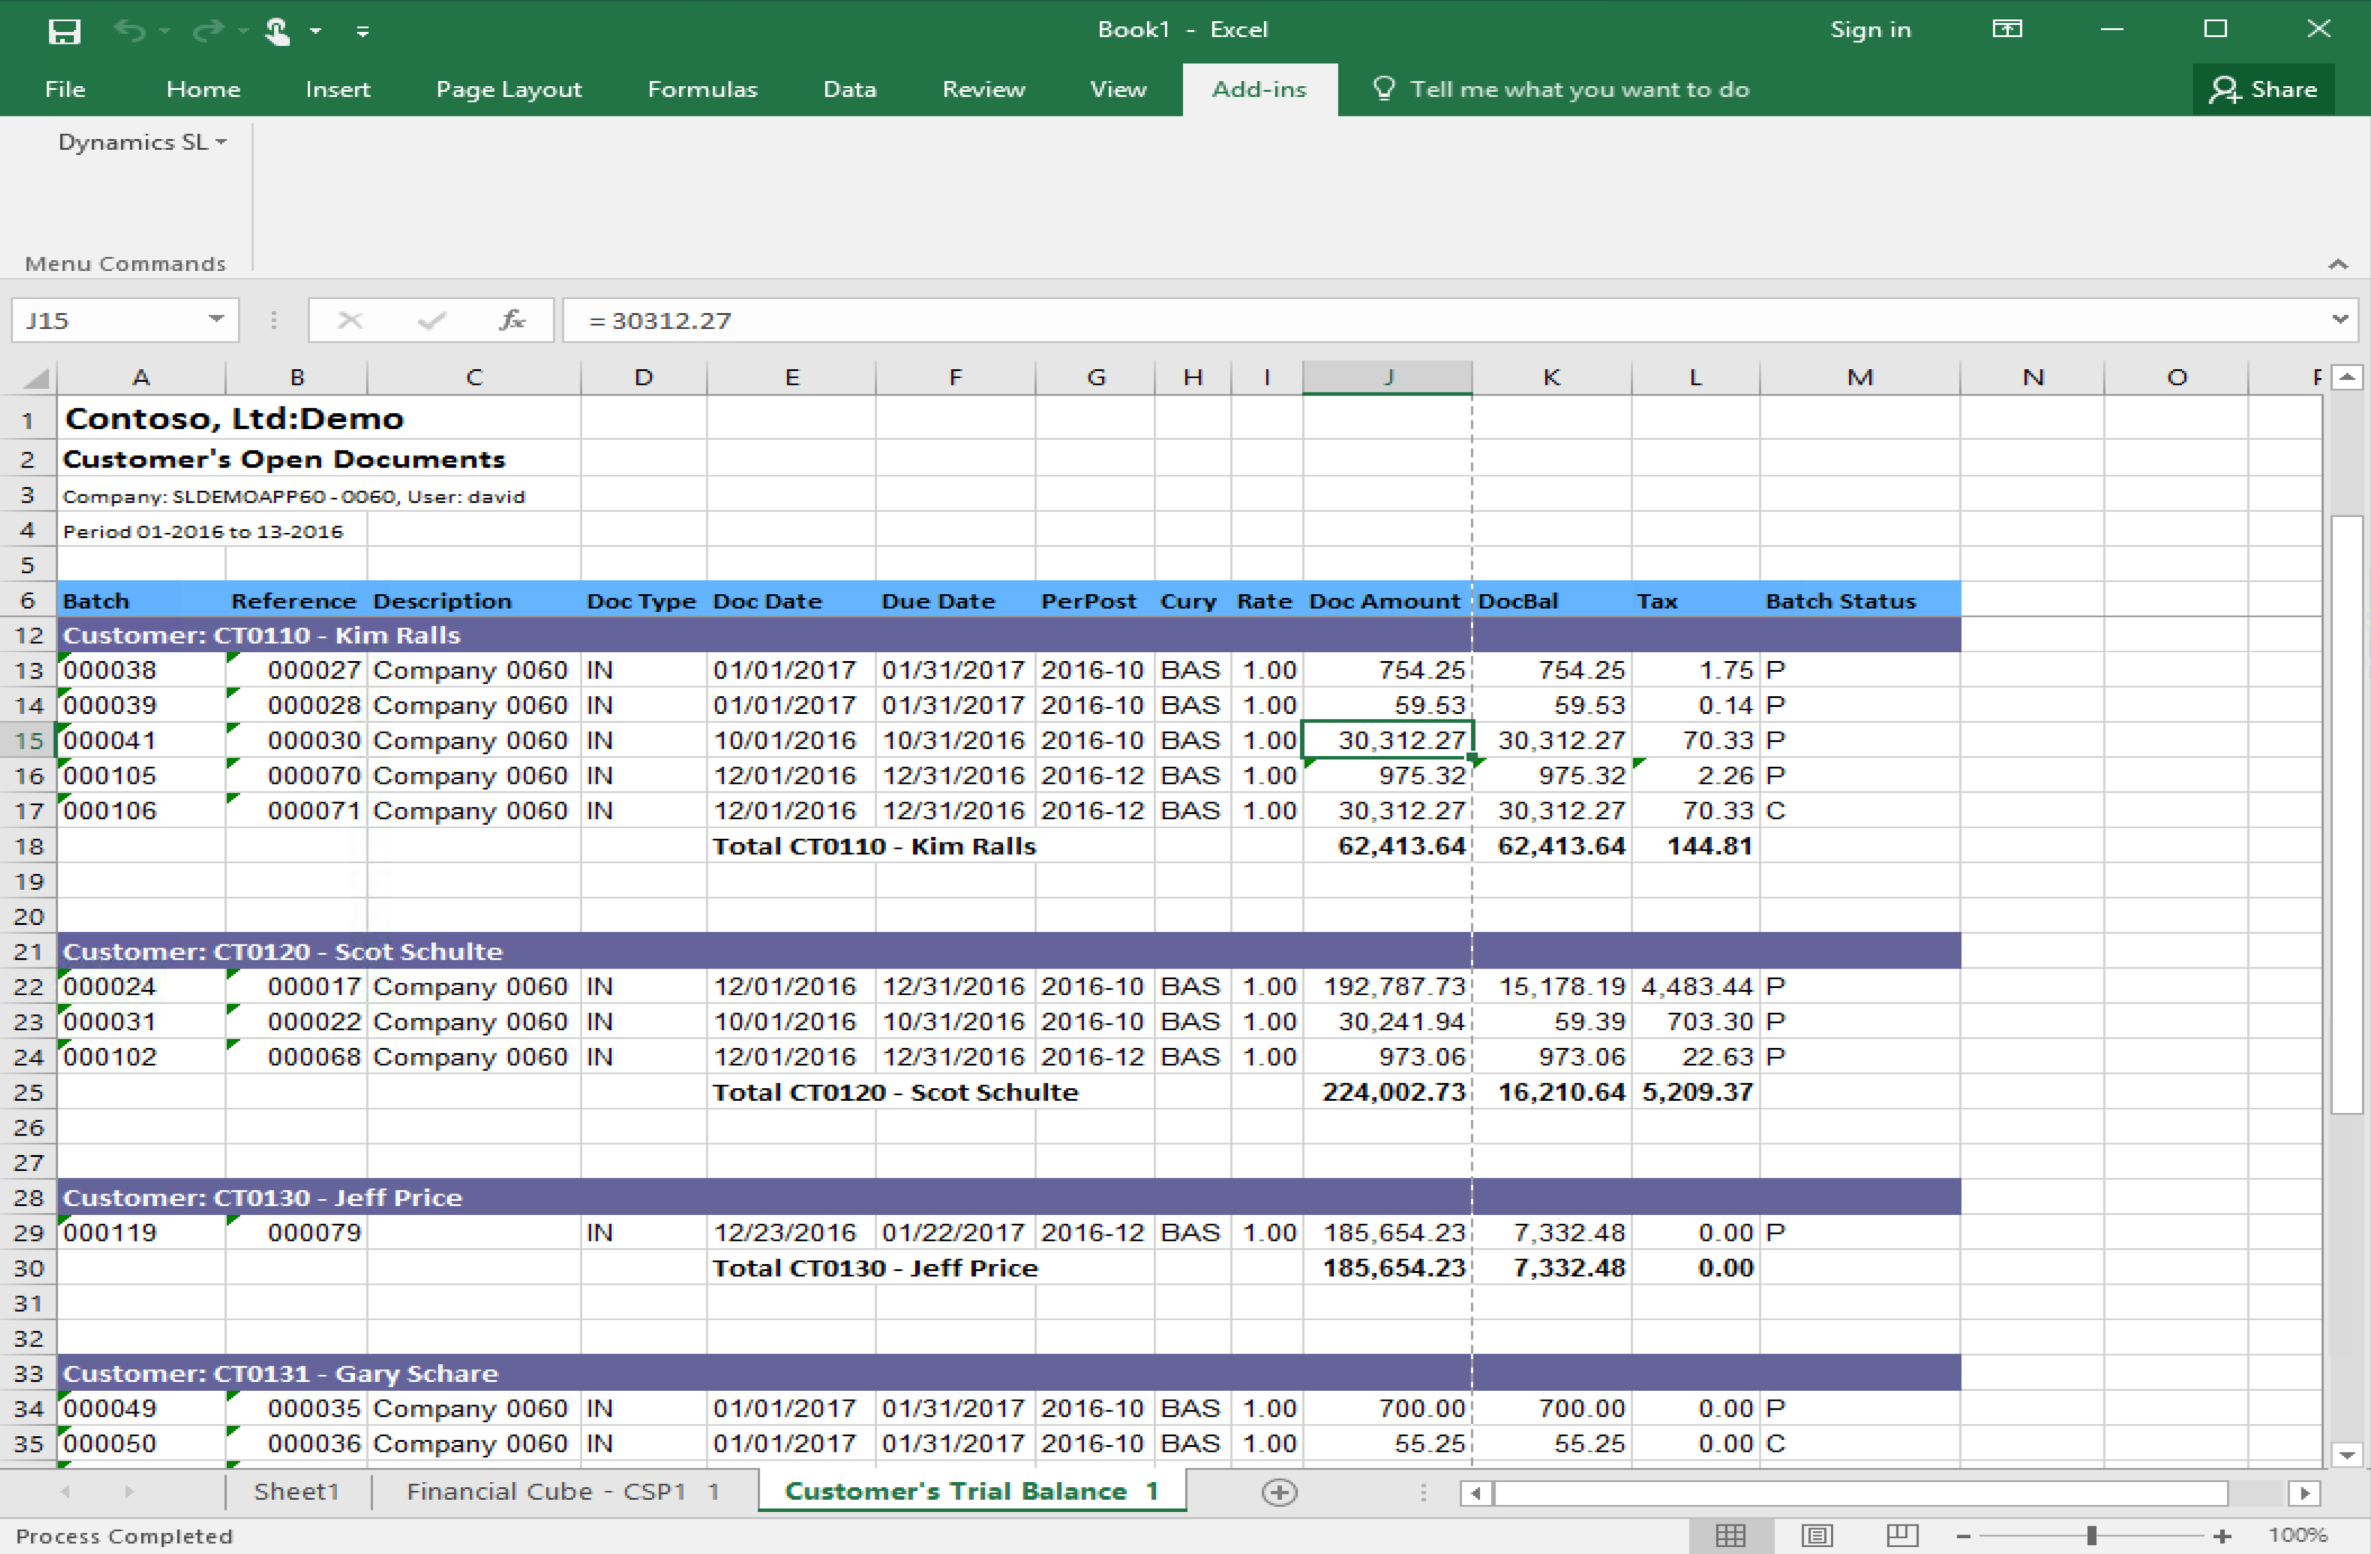
Account Receivables. Customers
Customer Open Documents and Customer Trial Balance allows users to quickly inquiry into the documents that customers might have in the system. Users can filter by dates, document types, if the document is open, etc. From the resulting spreadsheet, users can
drill down into the document detail, displaying debits and credits for the document selected
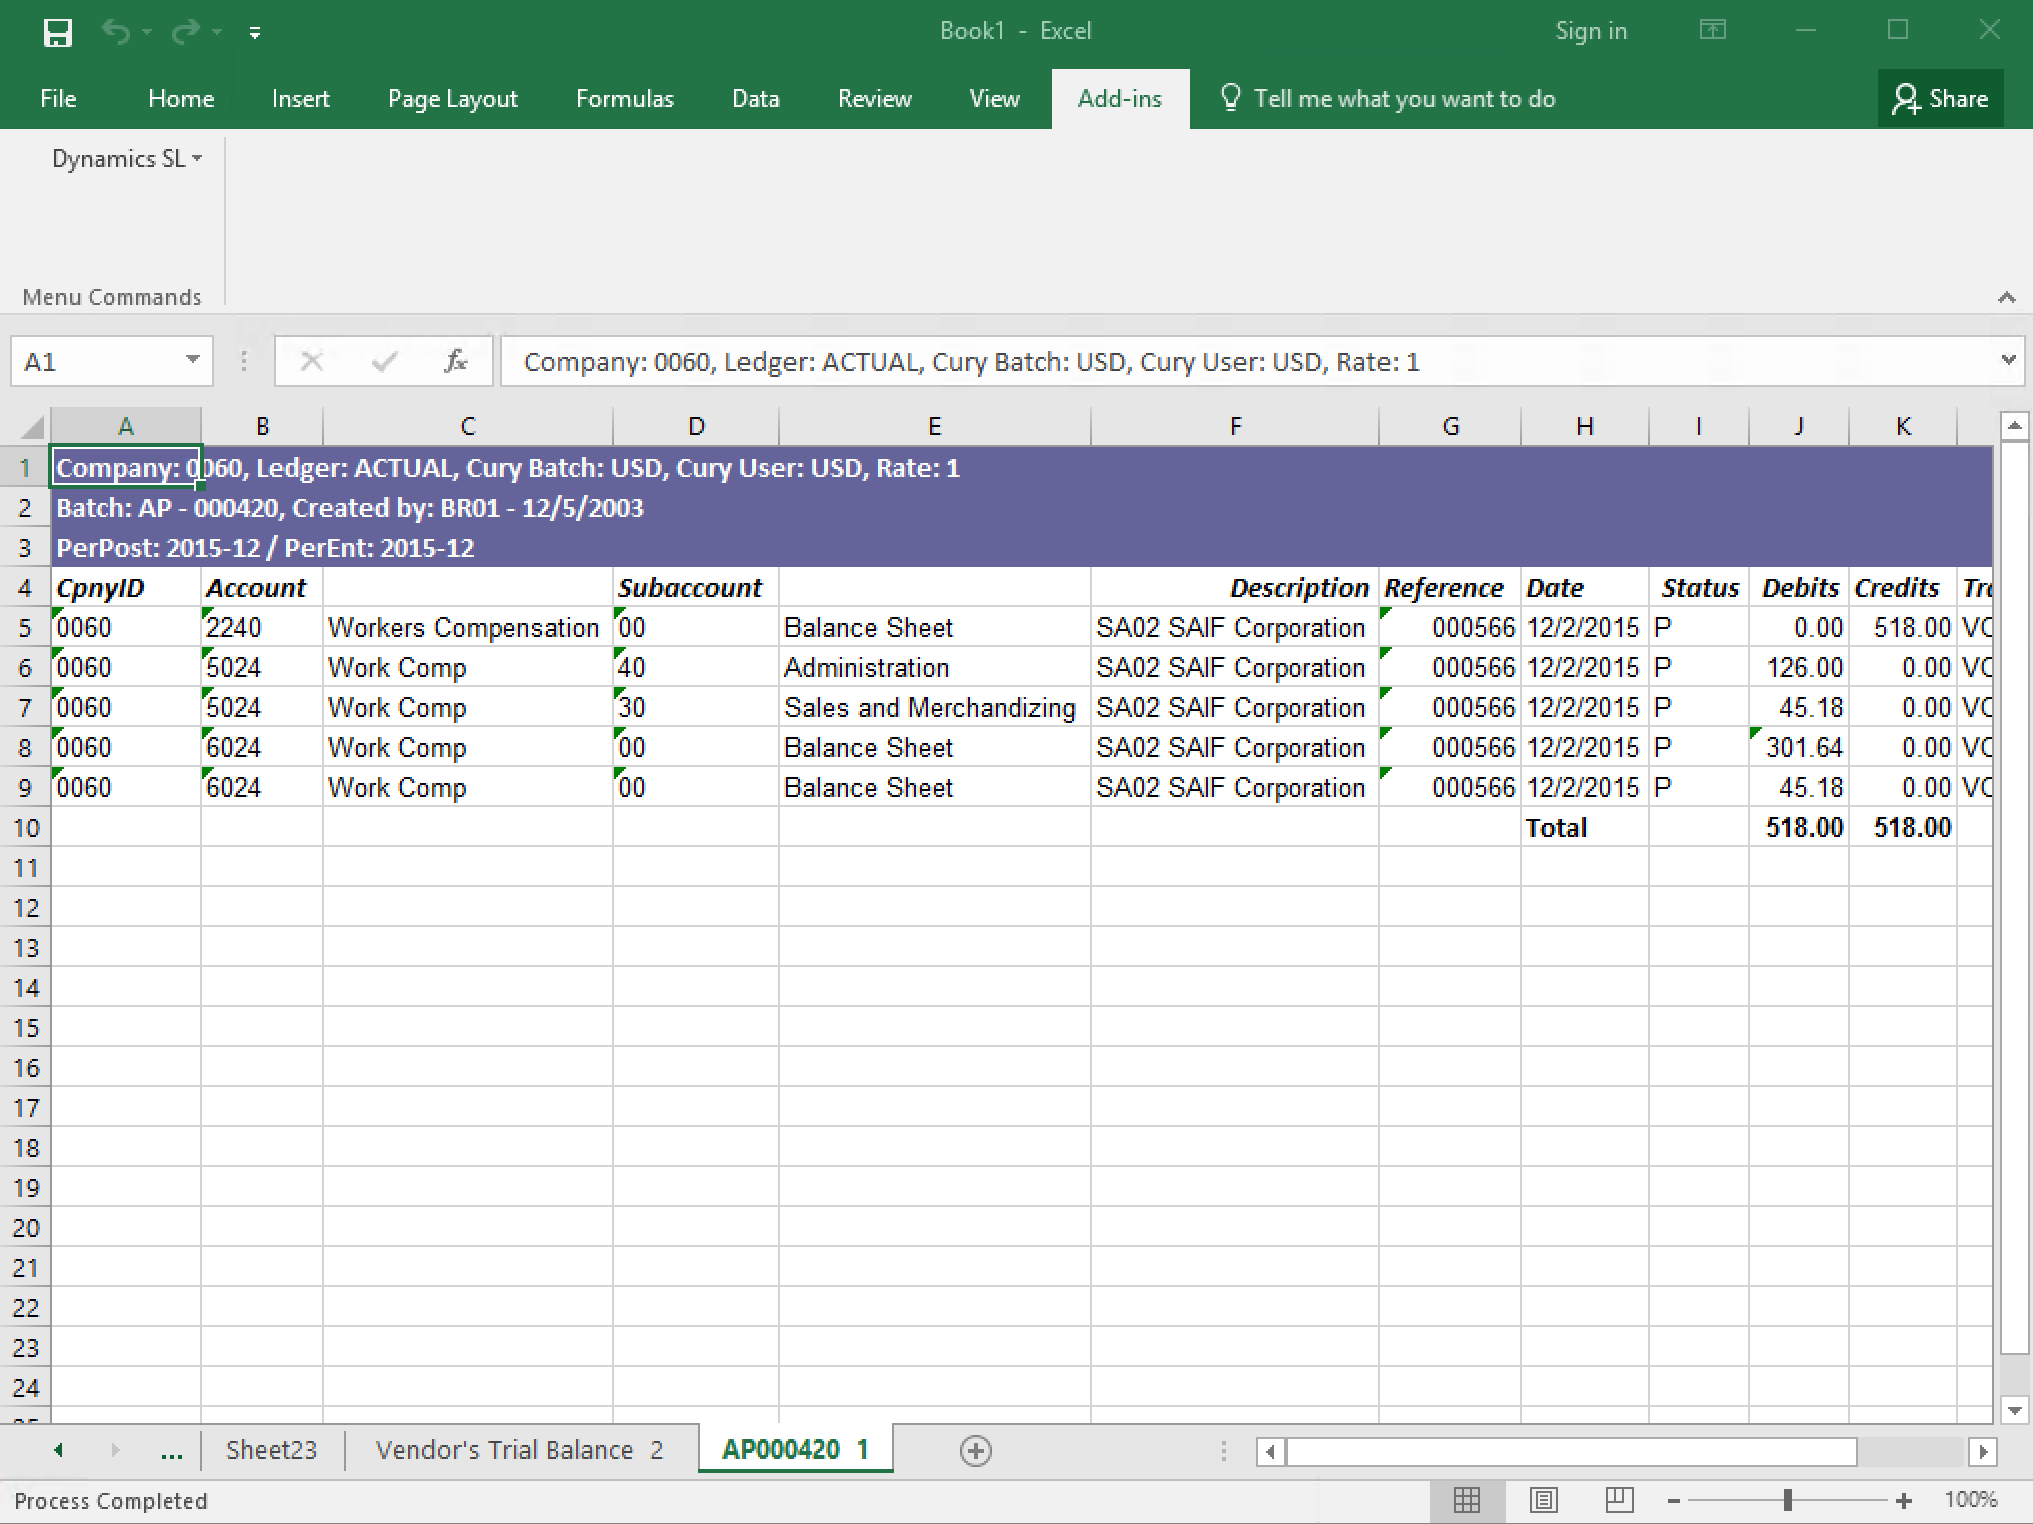


Account Payables. Vendors
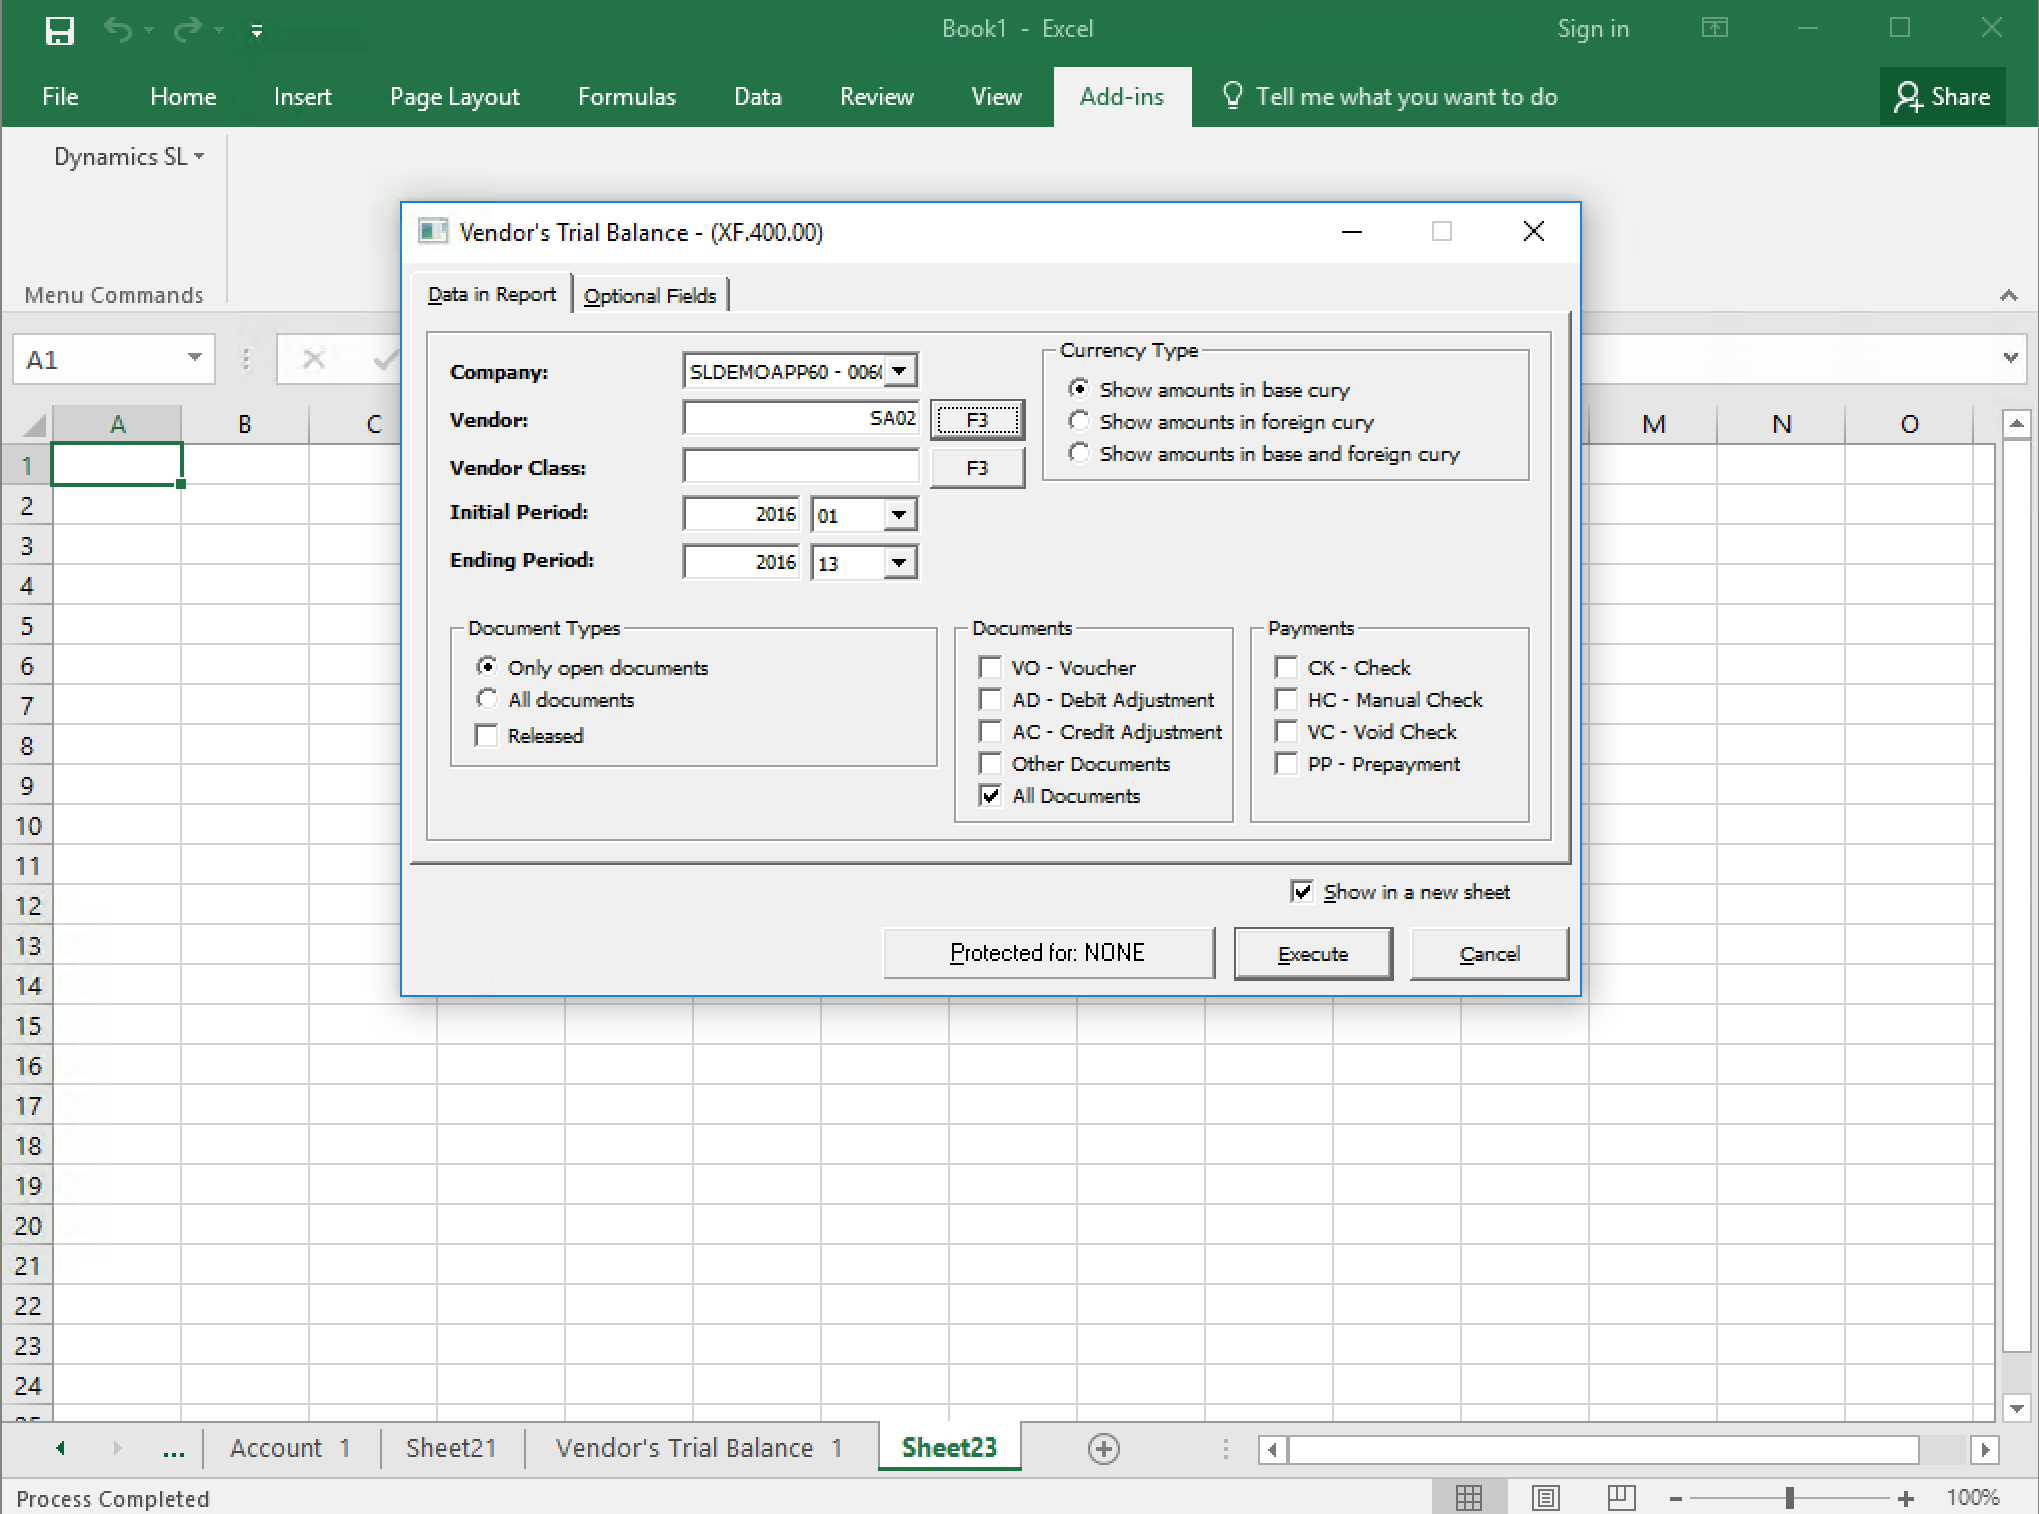
Vendor Trial Balance and Vendor Open documents allow users to quickly inquiry into vendor’s transactions. Very easy filtering, in the first image, the first letters of the vendor name were typed, and XL Analyzer filters the list. Trial Balance can be filtered by vendor type, dates, document types, status, etc. The resulting spreadsheet with the specific vendor documents, can then drilled down to the document (Batch) detail.
XL Analyzer is easy to learn and use
XL Analyzer screens are easy to read and user-friendly with smart lookups and dropdown menus. Regular SL users will find this tool to be a time-saver, while less familiar Dynamics SL users can analyze business data with Microsoft Excel with ease. All the dialog boxes are very easy to understand and use.
MS Excel Pivot Tables manager
M5 XL Analyzer comes with preconfigured cubes for General Ledger, Account Receivable, Accounts Payable, Inventory, Order Management, etc. You can easily add additional cubes in the Pivot Table manager for Dynamics SL. This will give users the ability to launch customized and preconfigured cubes from a simple menu.One great advantage of this Pivot Table manager or “Cube” Manager, is that every user that has MS Excel, will have access to instant cubes, pre-configured and customized for their job and functions.
Account Receivables. Customers
Customer Open Documents and Customer Trial Balance allows users to quickly inquiry into the documents that customers might have in the system. Users can filter by dates, document types, if the document is open, etc. From the resulting spreadsheet, users can
drill down into the document detail, displaying debits and credits for the document selected
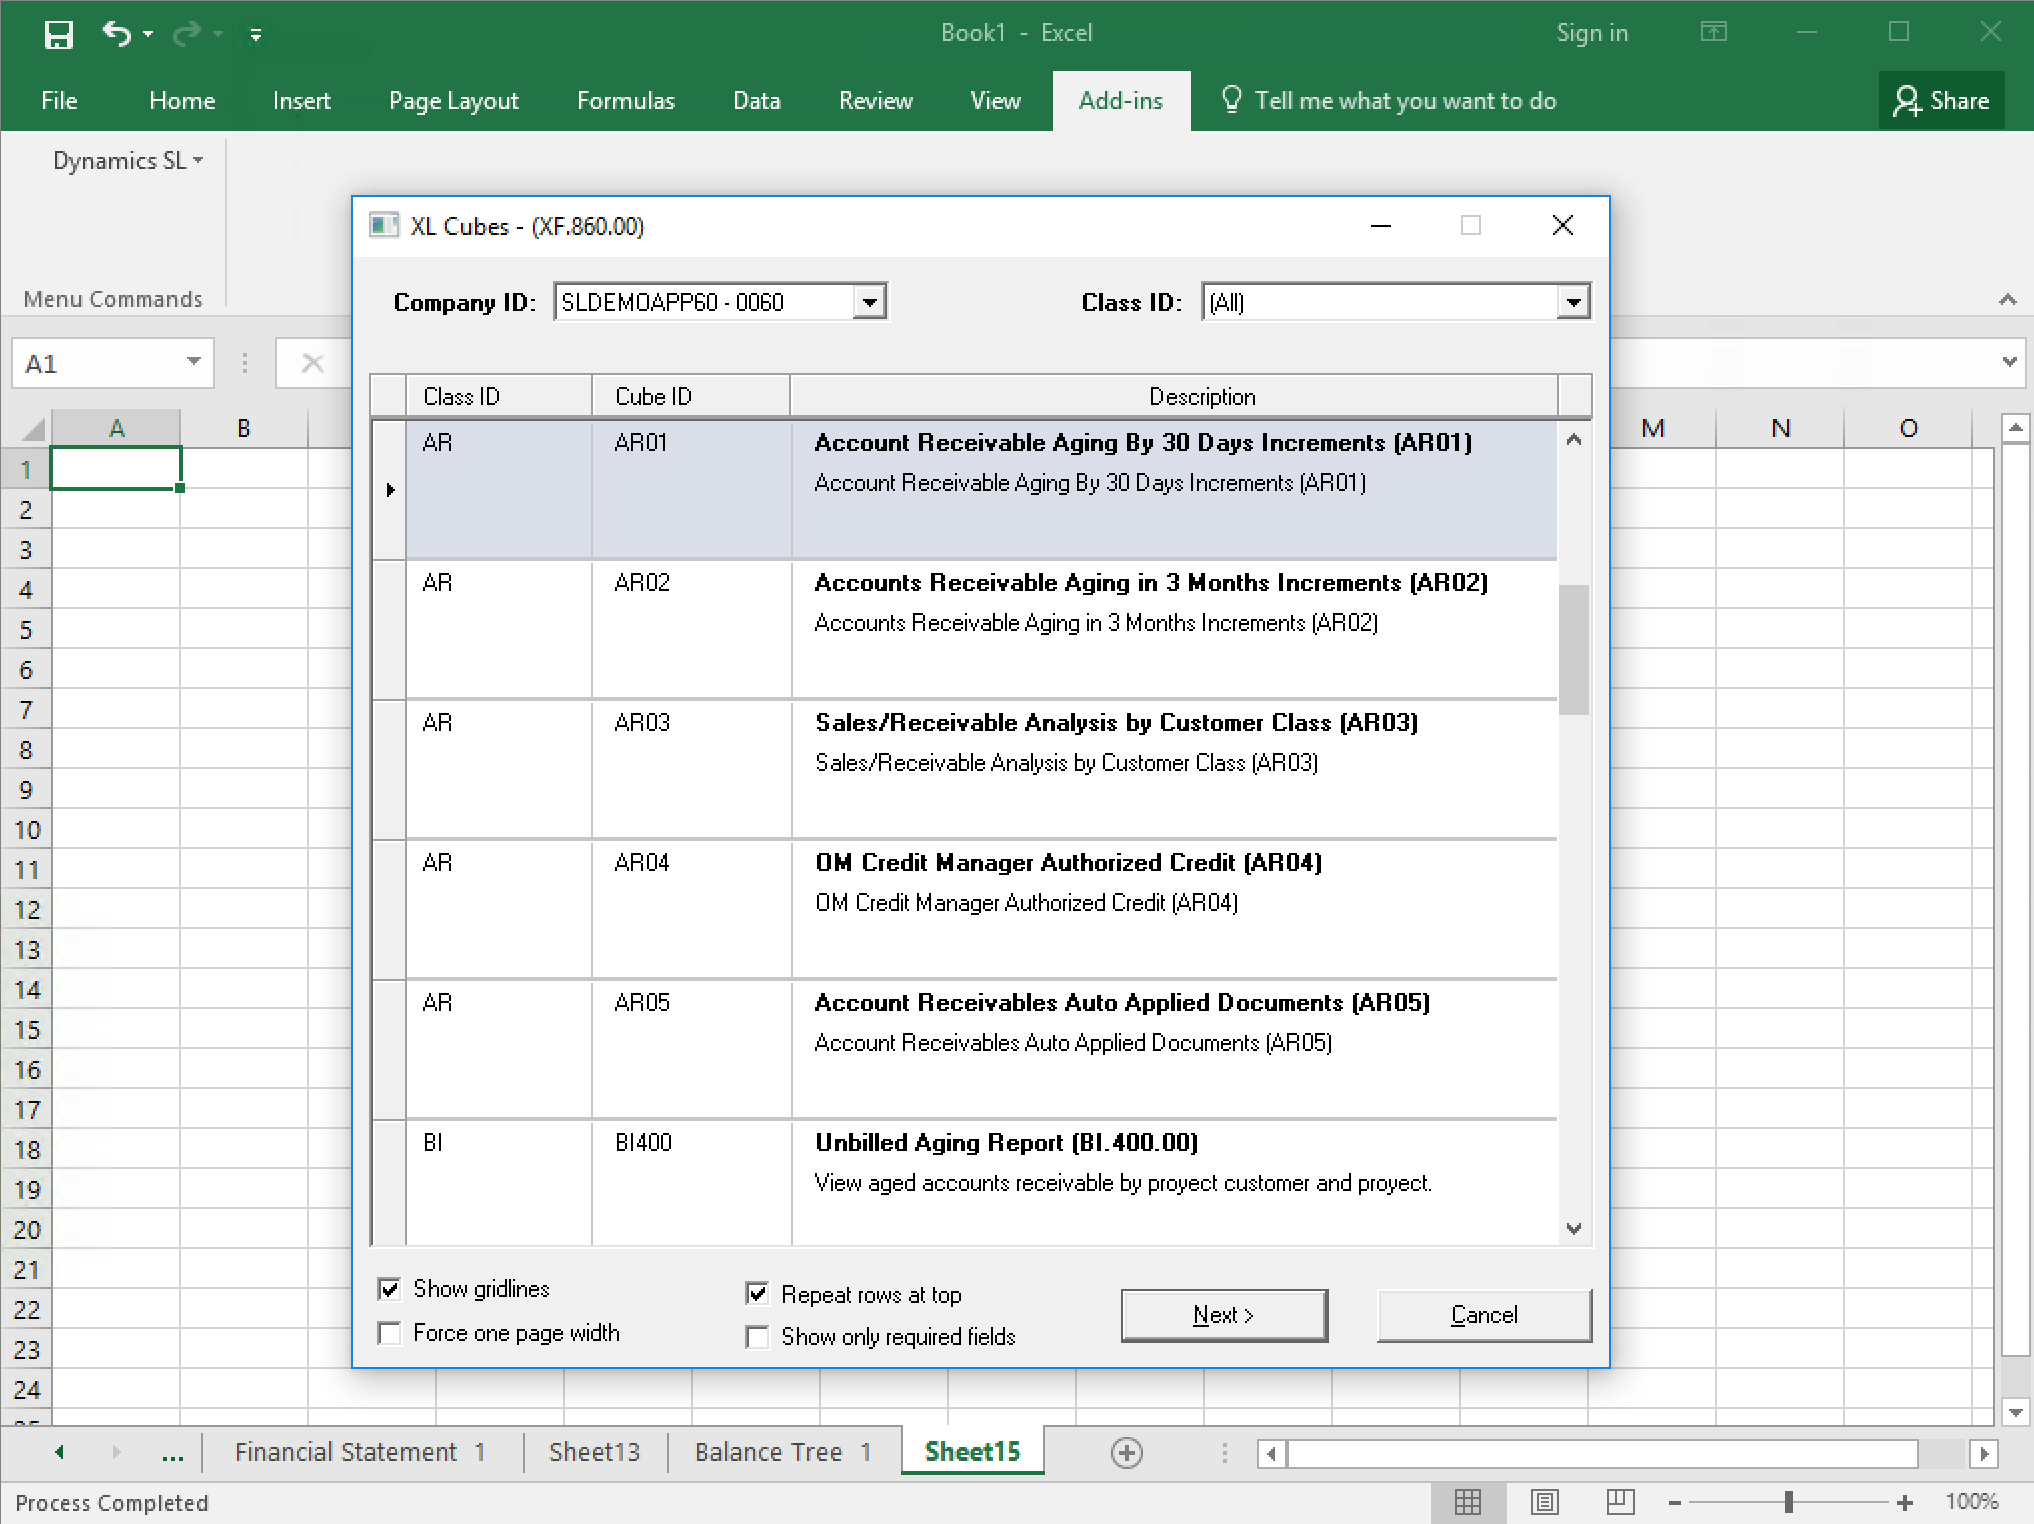
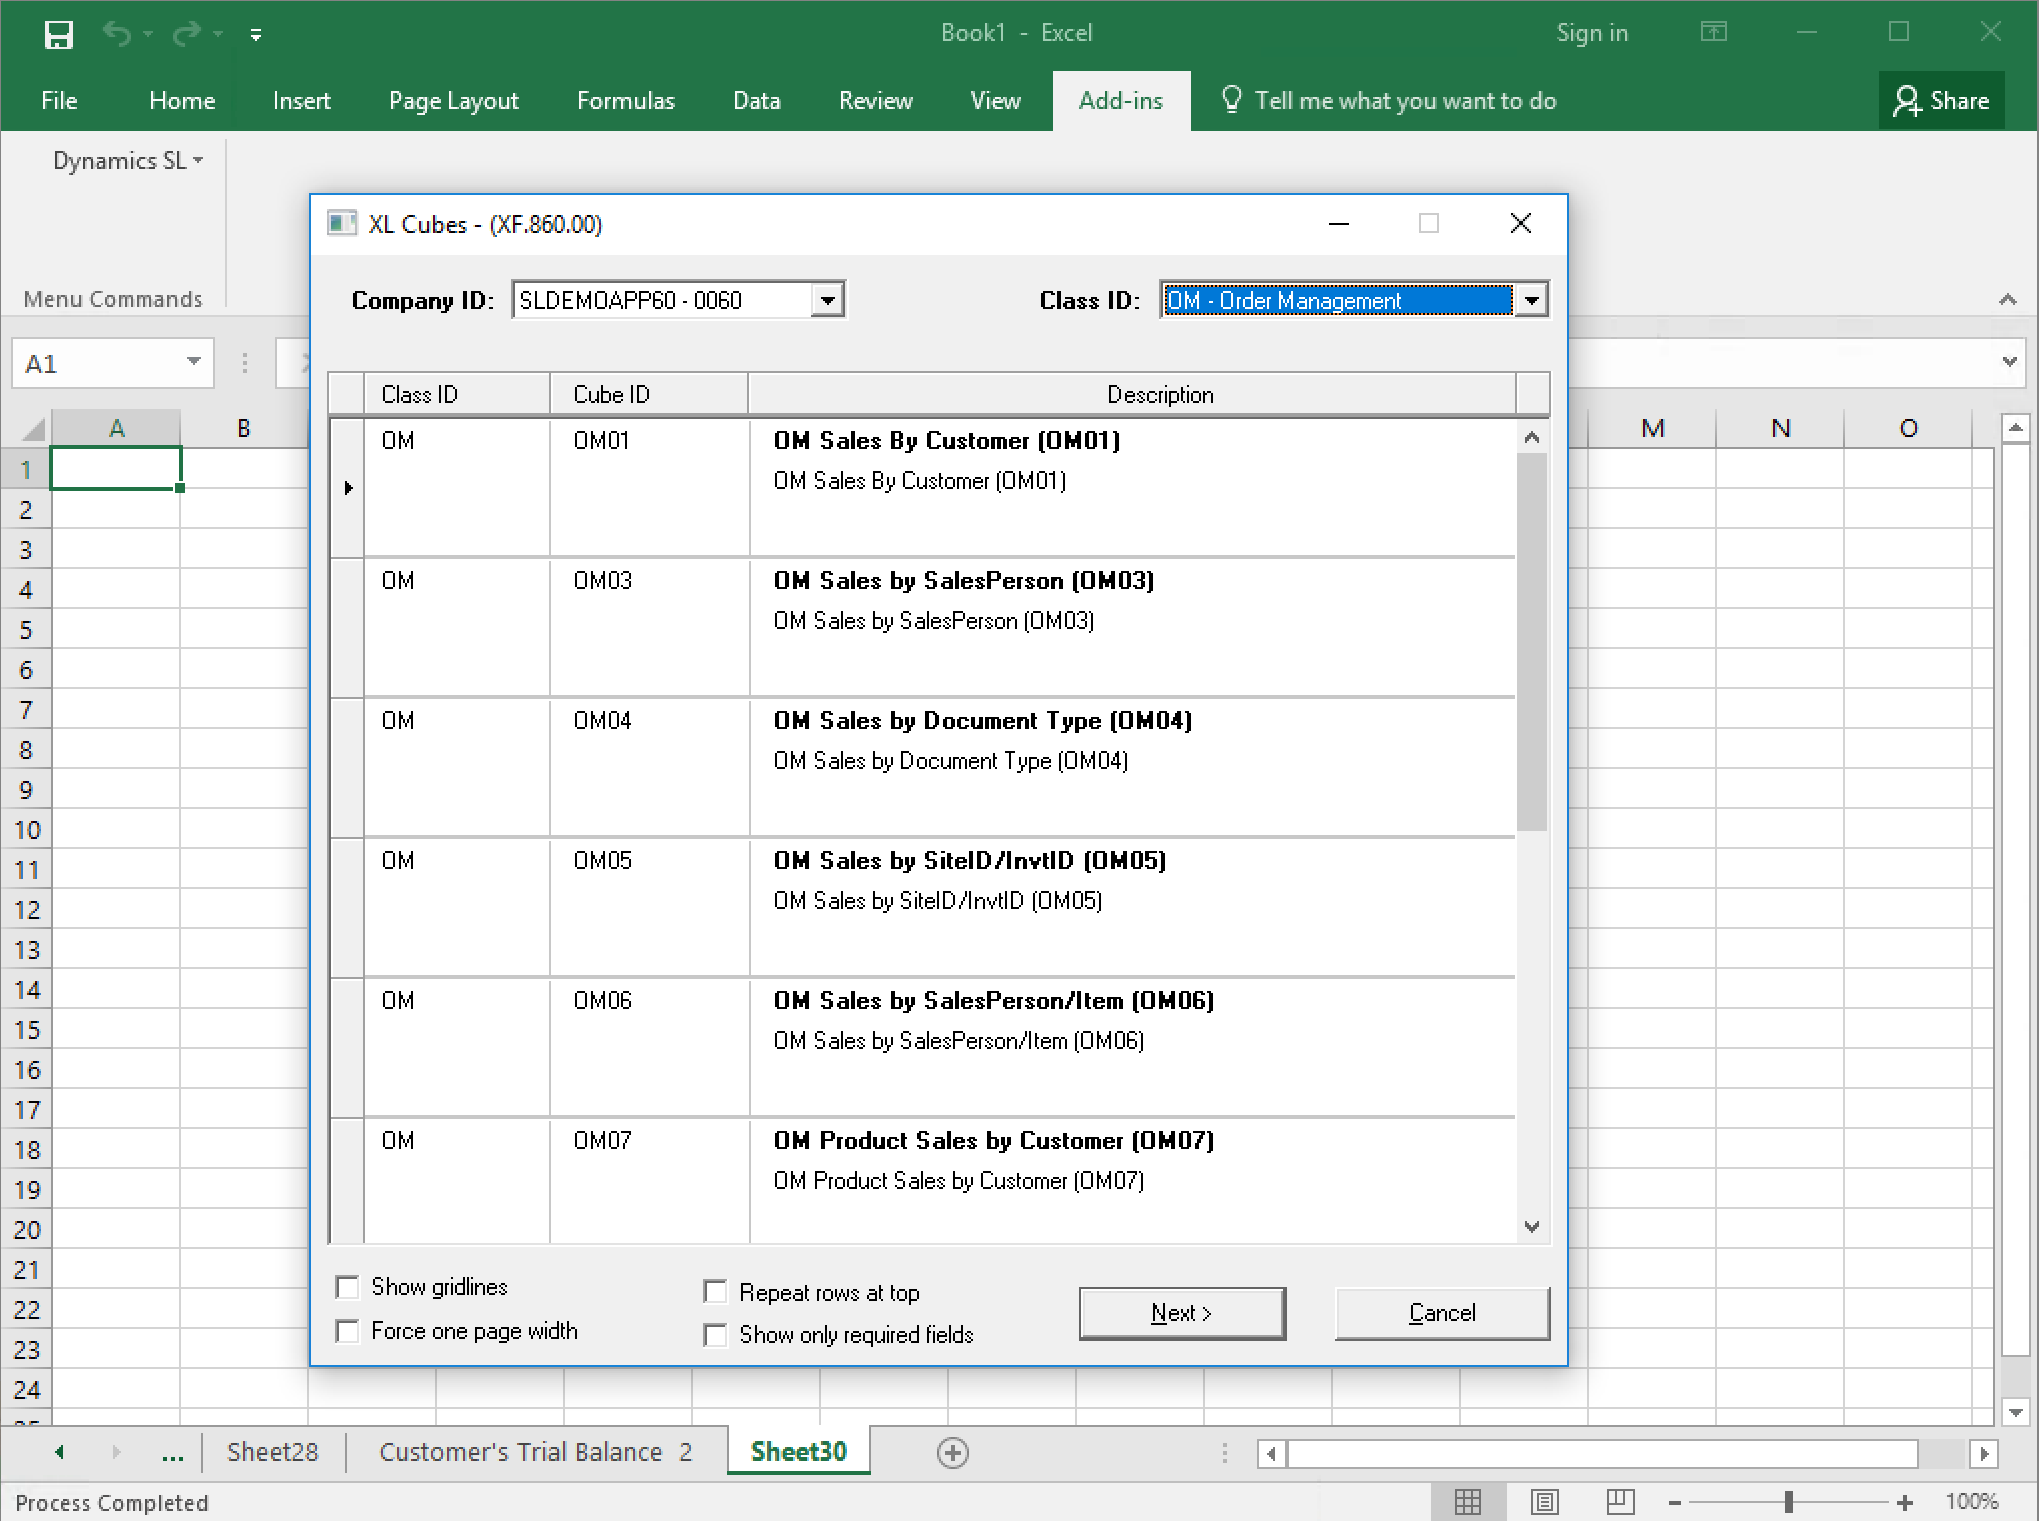
Pivot Table (Cube) launcher within MS Excel.
This is the interface available to all users to generate a Pivot table, within MS Excel. Juts select the module on the top, then select the cube needed.
Examples of Pivot Tables from Dynamics SL.
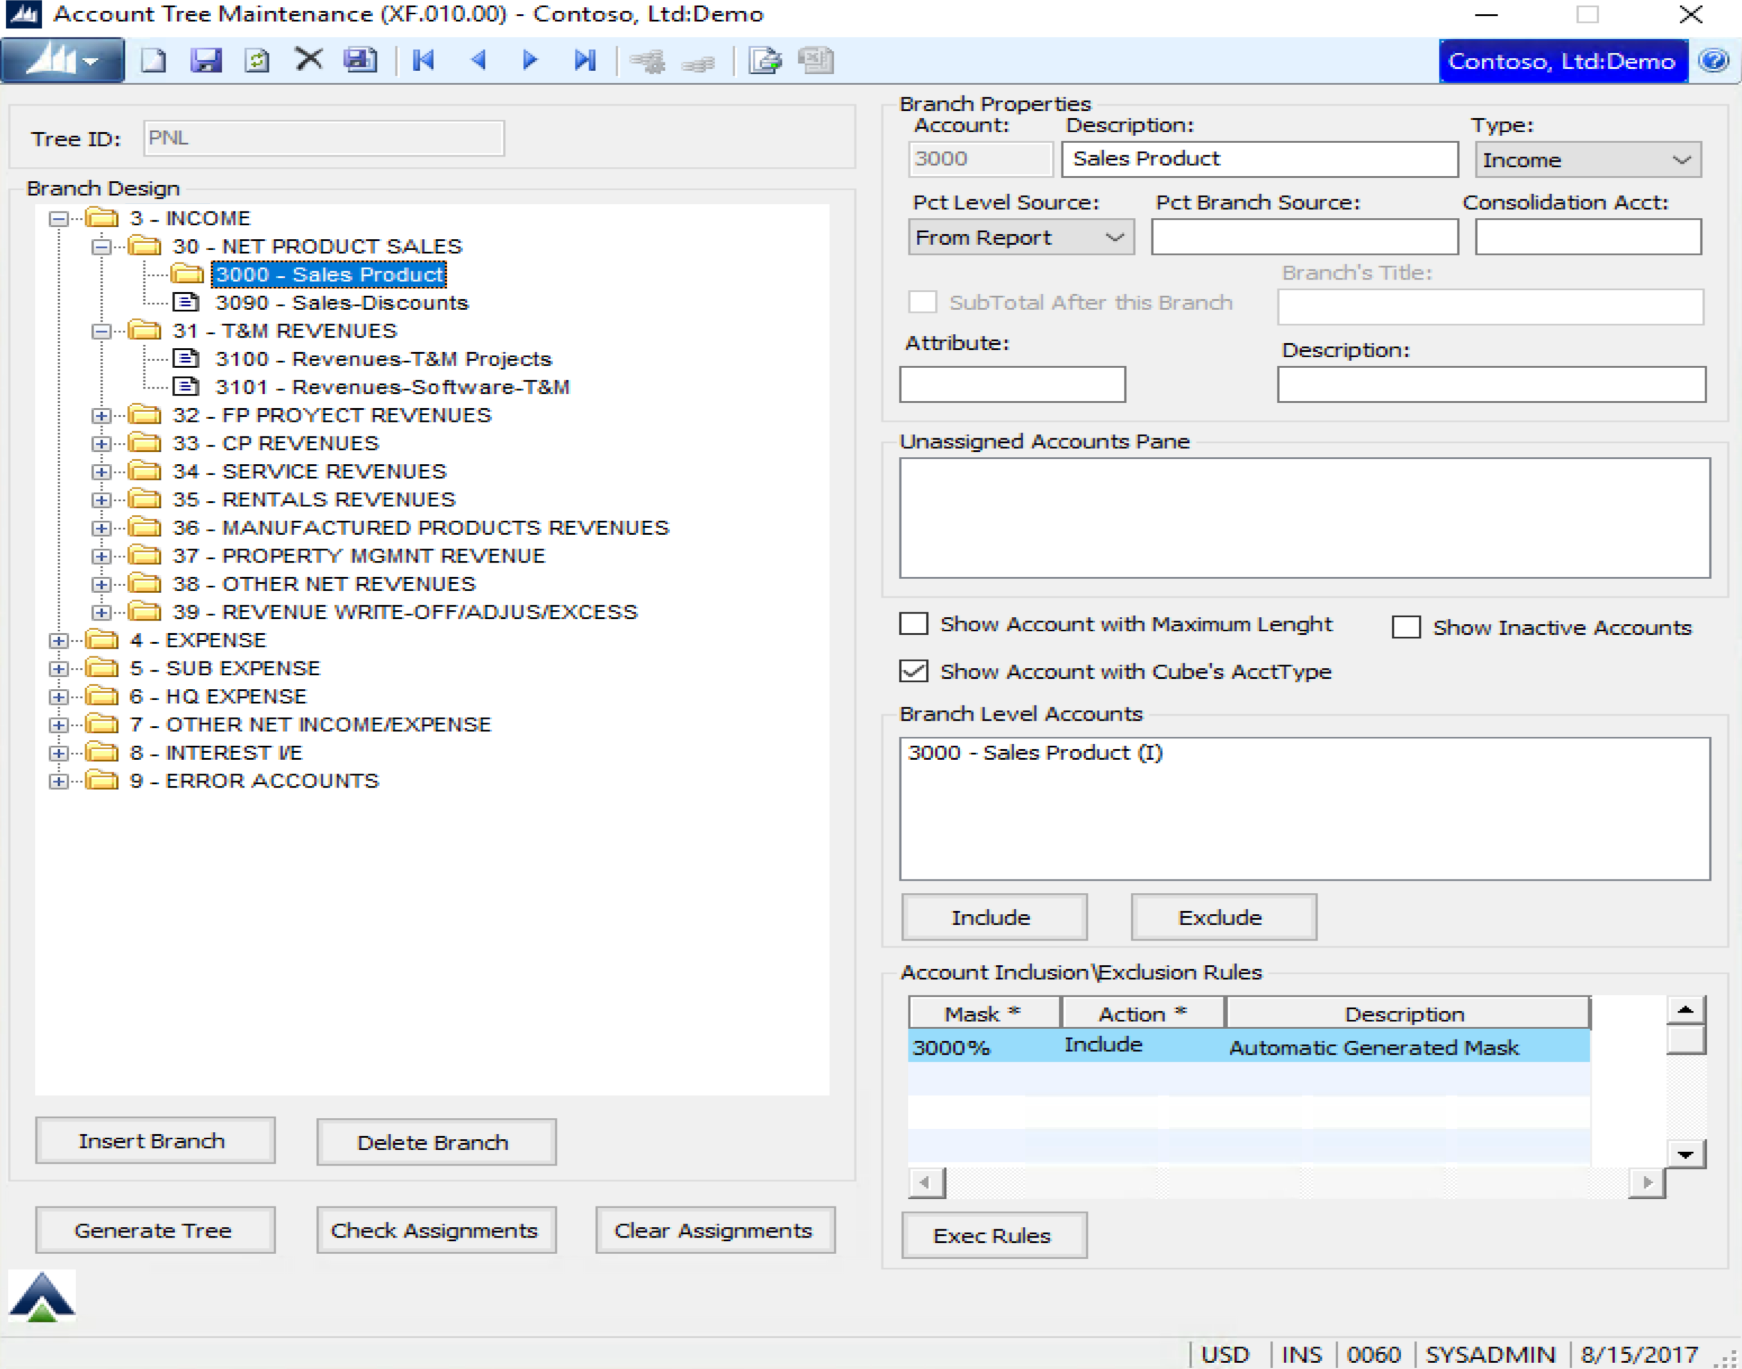
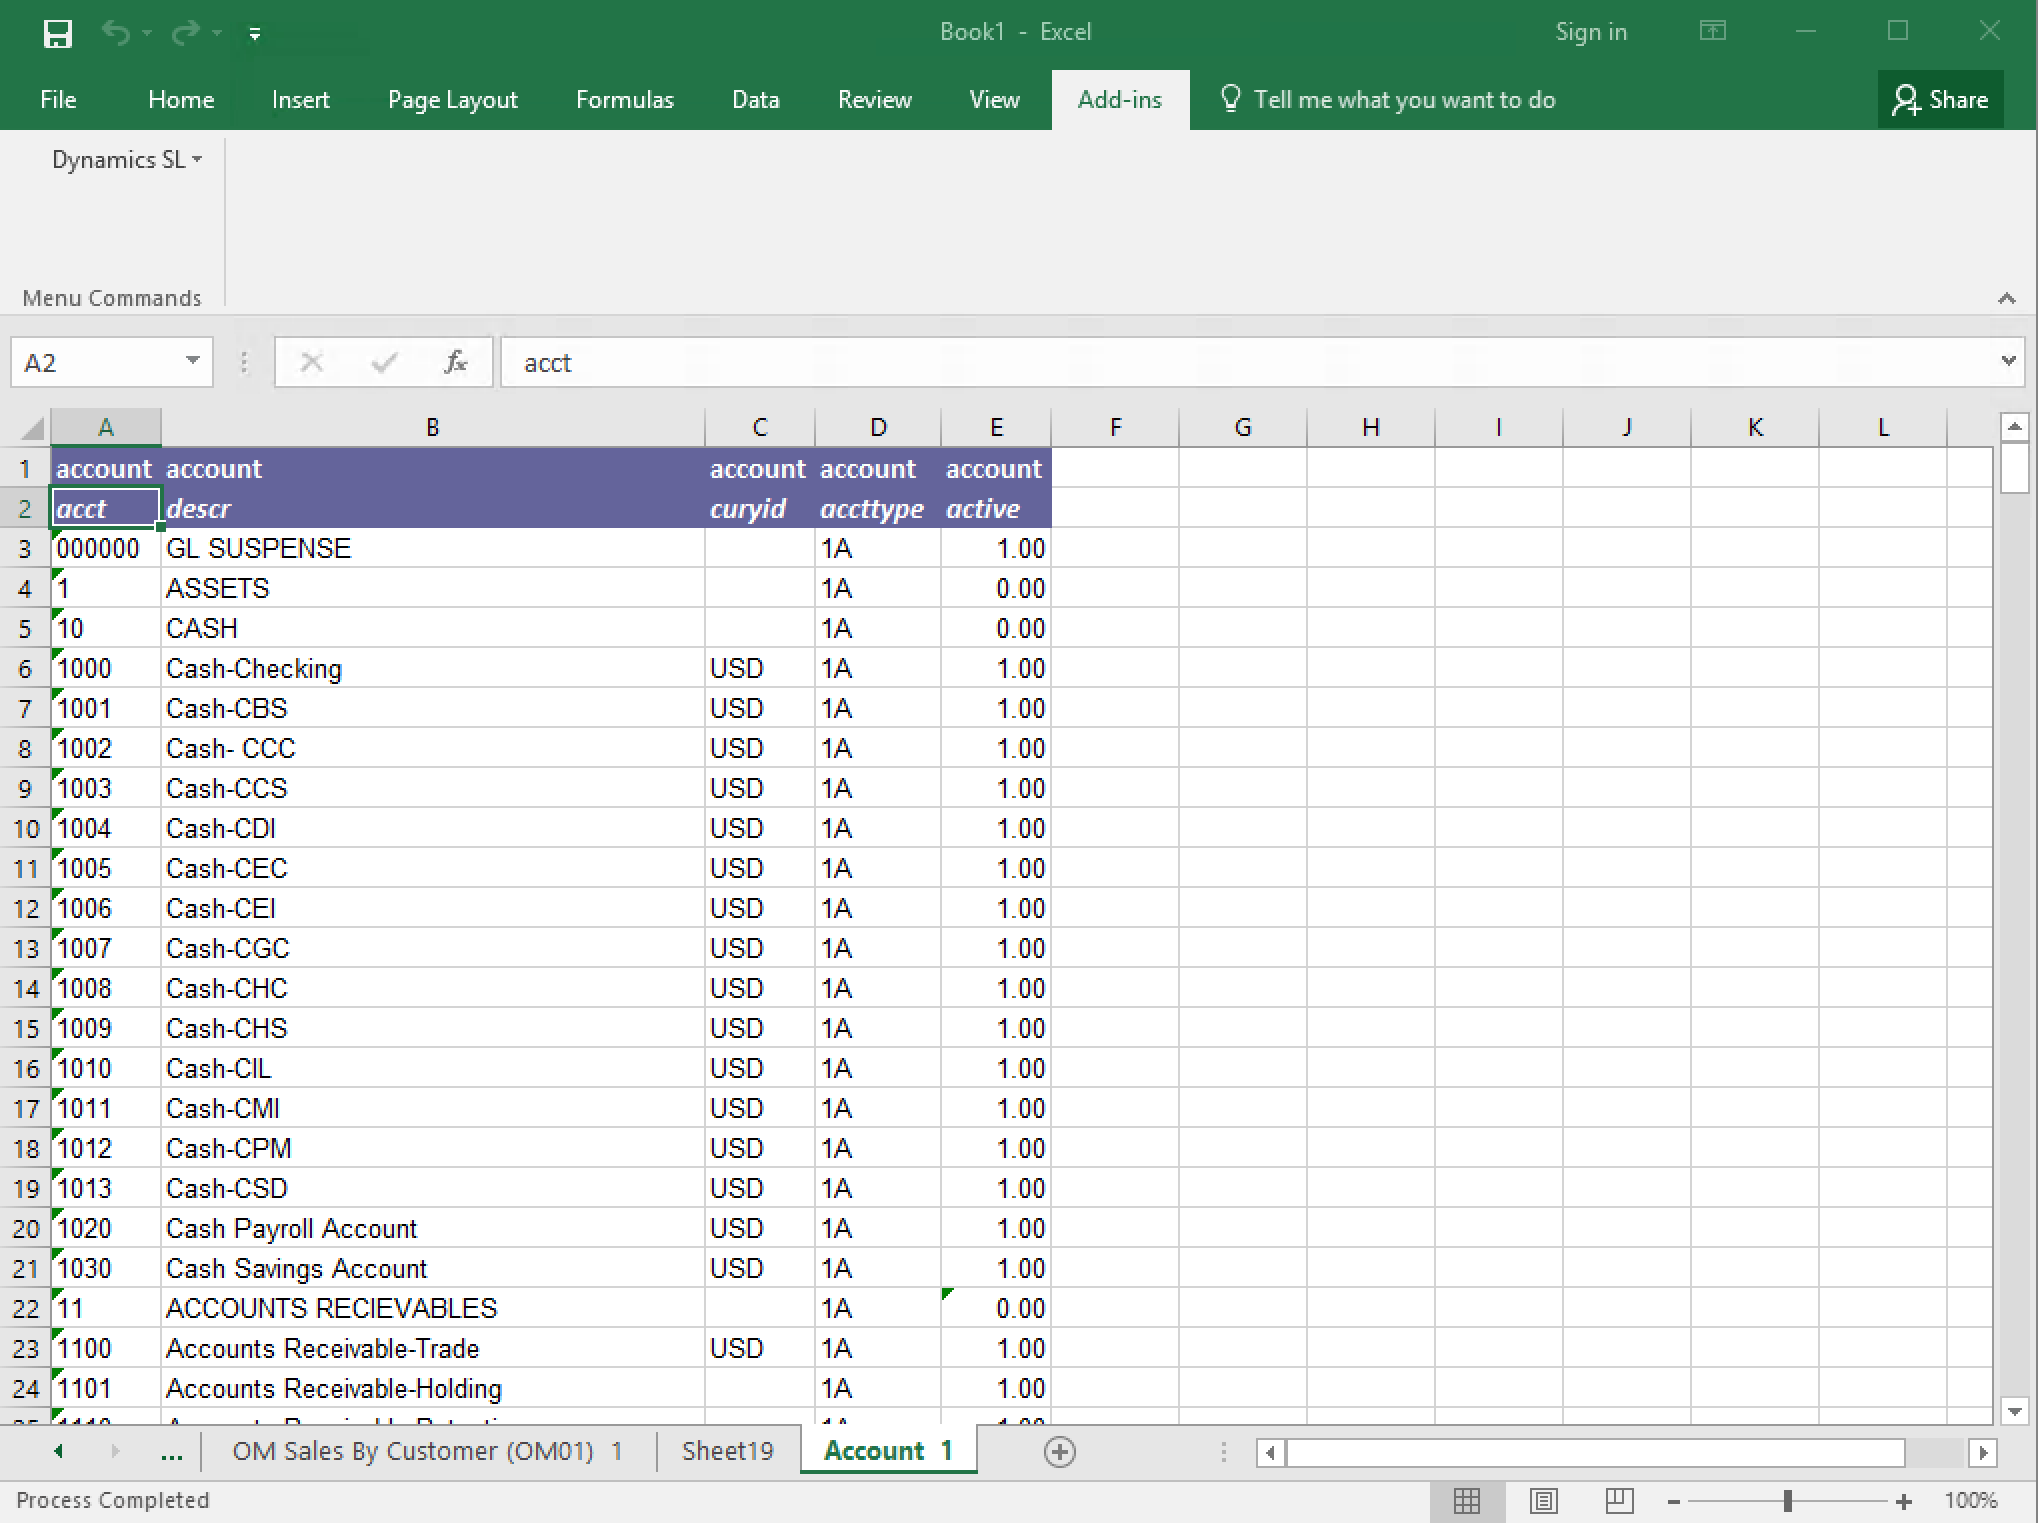
General Ledger hierarchy for Account and Sub-Accounts and Financial Statements
XL Analyzer adds hierarchy “Trees” to the chart of accounts. This is a 4 step hierarchy on top of the chart of accounts and sub-accounts that allows XL Analyzer to create financial reports and
cubes at different levels of aggregation. Easily create financial statements that range from the most detailed to brief and summarized depending on the user’s or situational need. This time-saving tool allows users to perform investigative financial analysis and troubleshooting by having different levels of aggregation of Chart of accounts, sub-accounts, sub-account segments, periods, years, ledgers, account classes, module, among other dimensions. XL Analyzer is particularly useful during month-end or year-end closing and auditing.

Hierarchy tree maintenance.
In the these 3 images, you can appreciate 3 different levels of aggregation for a Profit and Loose statement.
Many Types of Out-of-the-box Analysis and Inquiries
XL Analyzer reports and cubes are easy to use and available from MS Excel to anyone with the proper access rights. Examples of reports provided are:
- Trial Balance.
- Period Balance Sheet and Annual Balance Sheet.
- GL Integrity.
- Detailed General Ledger (Account Inquiry).
- Batch Inquiry.
- Vendor and Customer Analysis (Multiple variations: Aged, Open Documents).
- Dynamic Financial Statements (Pivot Table or Spreadsheet type),
- Inventory Balances and Analysis
- Sales and Profitability Analysis
- Project Controller Time Sheets, among others.
- The inquiry tools support multi-currency and multi-company.
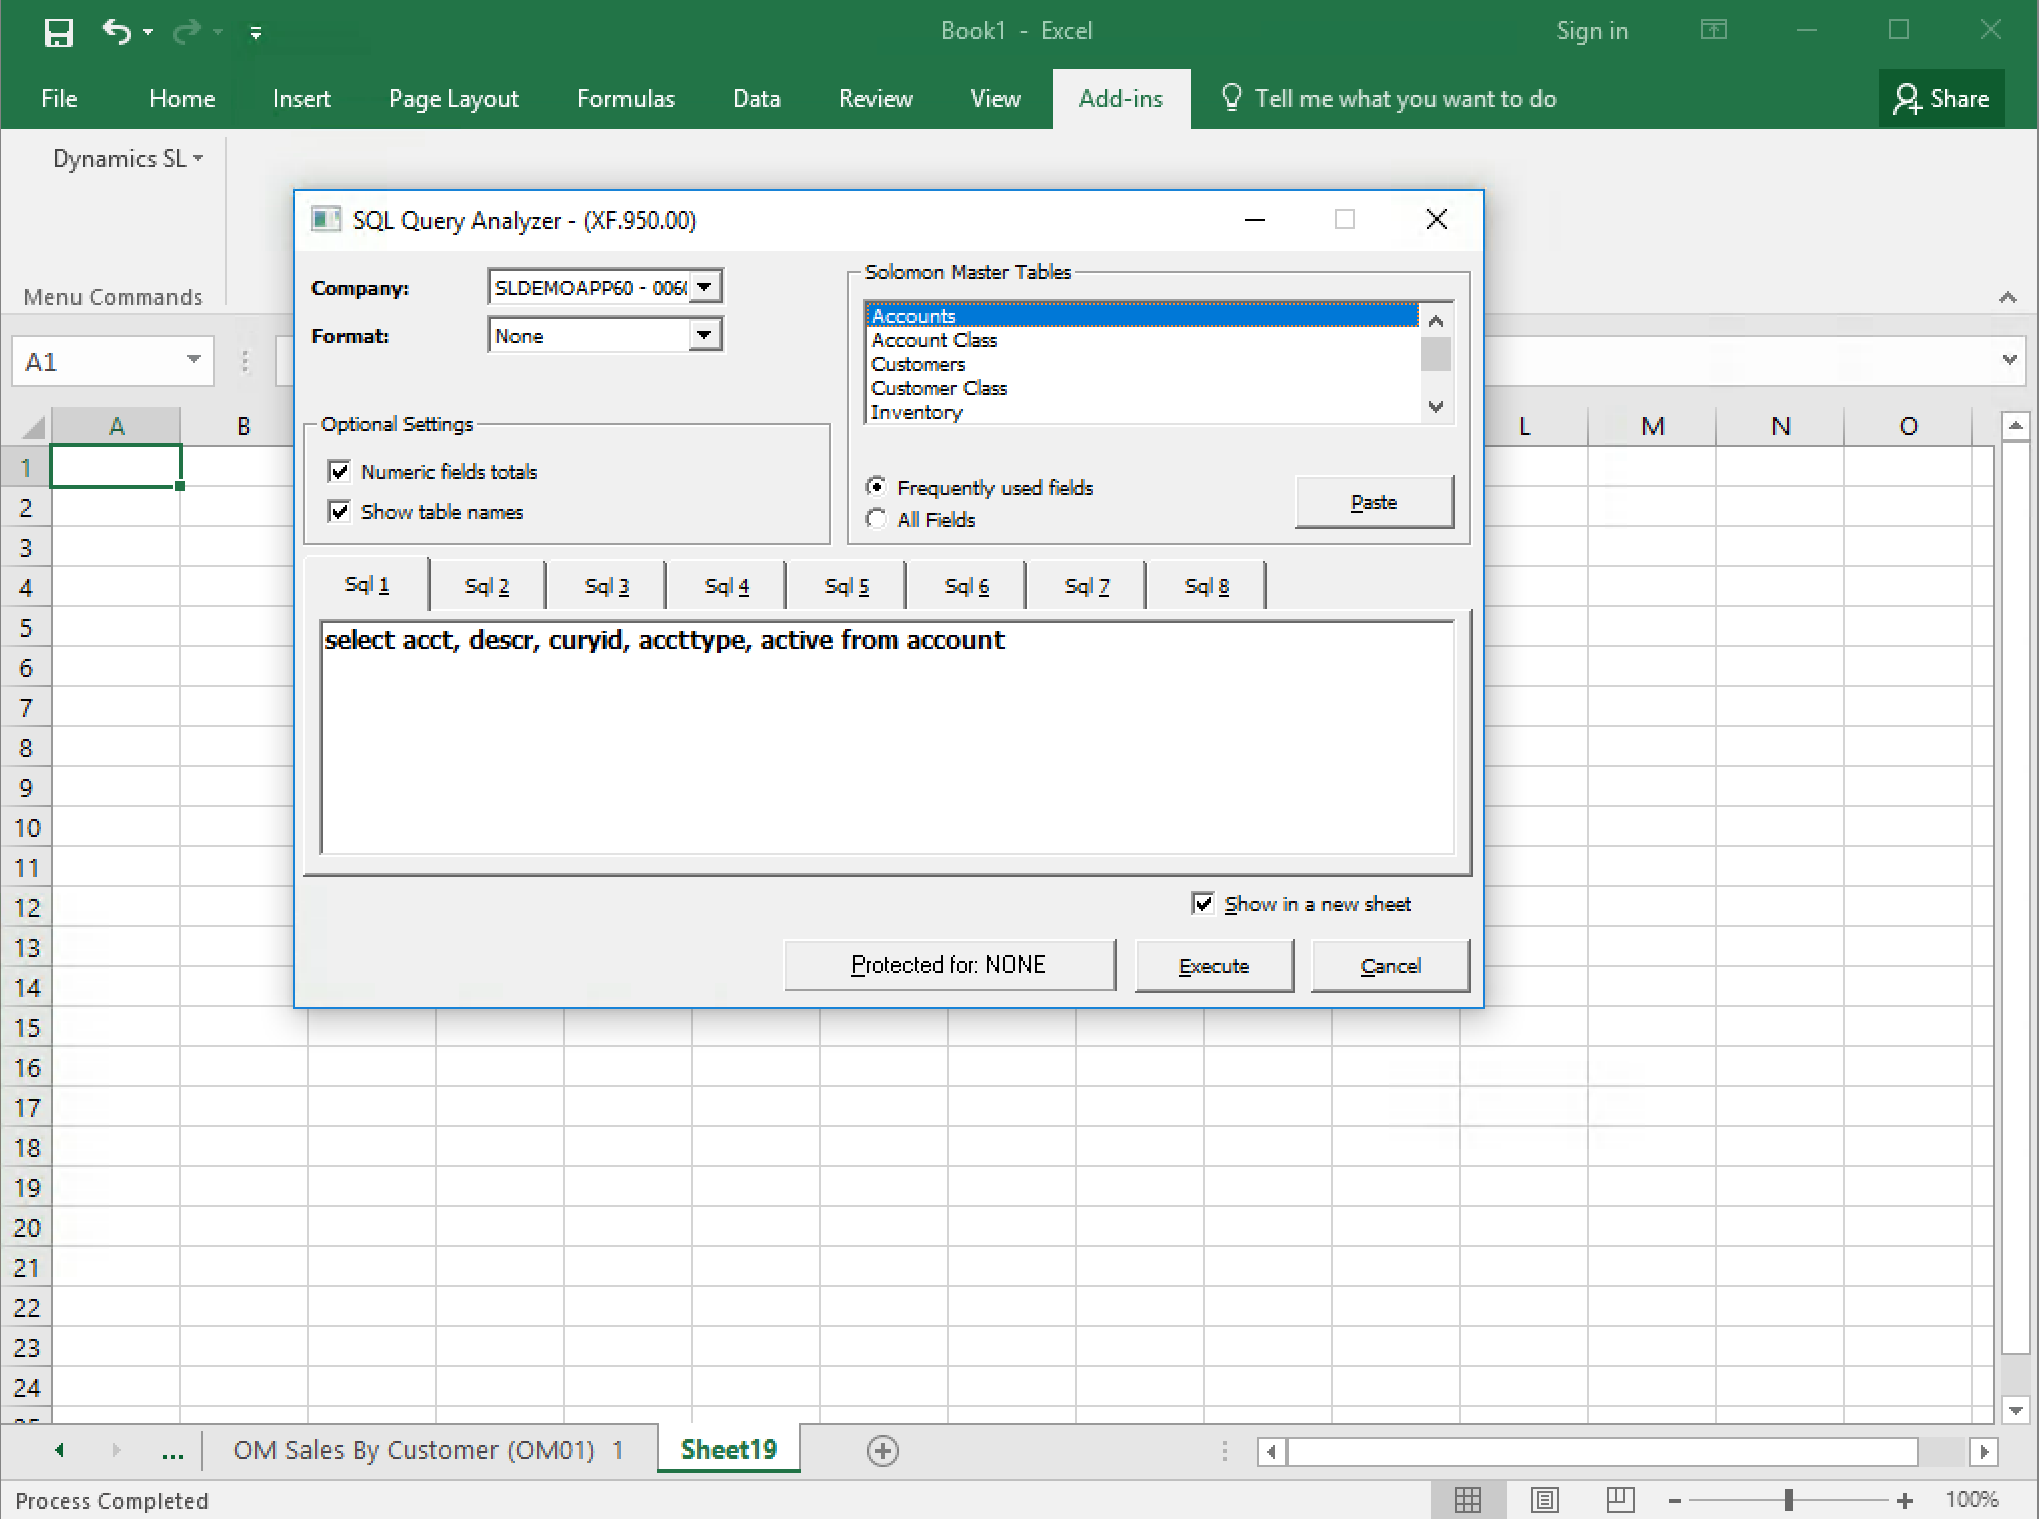
SQL Query interface from Excel
XL Analyzer provides a very easy interface for read-only SQL queries. This allows users to get a custom report in MS Excel form directly. SQL Statements can be typically provided by consultants, advanced users or IT administrators that know the database.
Comprehensive Lookup-ups
Easier than using Crystal Reports and Dynamics SL’s Report Options Interface (ROI). Users will no longer have to know the name of fields and what is in them in order to filter a report.
Make work life easier with Excel
Working within Excel, users can easily highlight, add formulas, and delete columns or rows on the fly, much easier than manipulating reports in SL/Crystal Report. End users can quickly modify, format, share and collaborate on spreadsheets that will be sure to increase team productivity.
Month-end closing becomes easier.
XL Analyzer is particularly useful during month-end closing. Your now easy to read and use spreadsheets will be context sensitive, allowing users to drill down to bring the underlying information into another sheet for more detailed analysis. From a P&L or Balance Sheet users can drill down to the accounting inquiry then to the document level (batch, invoice, etc.) optimizing month-end closing.
Lowers the cost of external auditors.
During audits, XL Analyzer will allow external auditors to inquire and explore the Dynamics SL data dynamically with little knowledge of the system. To the aid your company, this reduces the need for auditors to ask for reports and data analysis.


